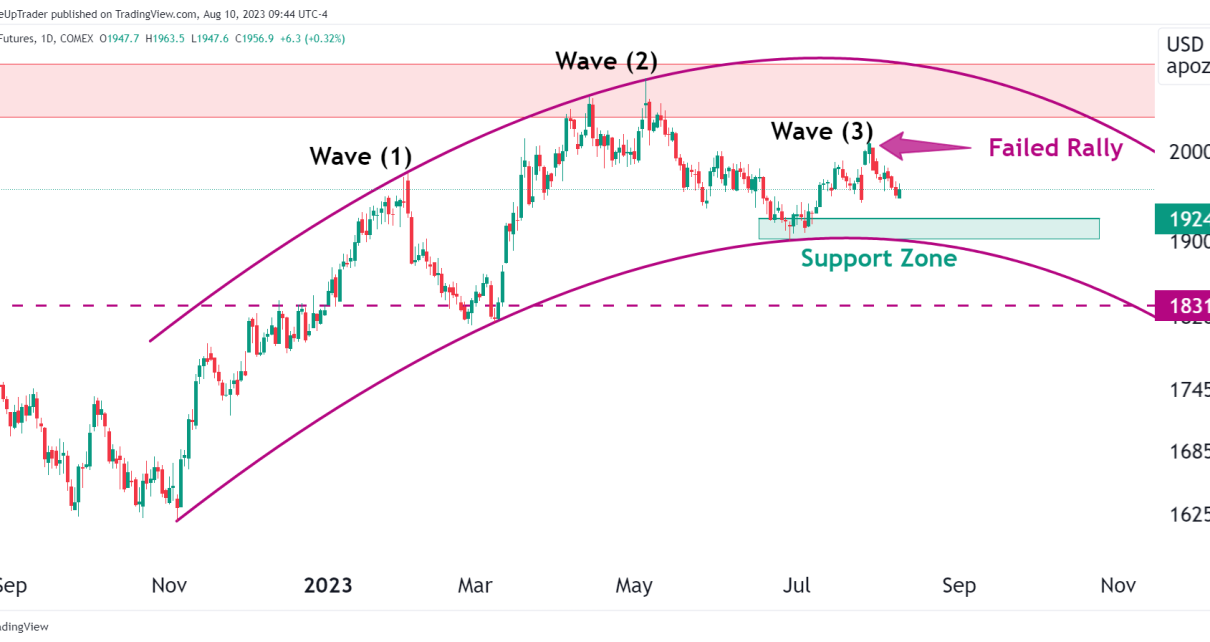
Nasdaq 100
Technical Analysis

E-mini Nasdaq 100 Futures (NQ): Technical Analysis Recap

Prices rally through minor resistance 38% Fibonacci target level reached Bullish Engulfing Candle forms on the Weekly Chart Bullish Weekly Engulfing Candle Last week’s trade saw a bullish engulfing candle close on NQ after three consecutive weeks of red candles. The entire candle has traded below and above the previous week’s trading range and closed Read More…

Nasdaq 100
Analysis

Technical Outlook: E-mini Nasdaq 100 Futures (NQ)

A bullish breakout has occurred above the minor consolidation zone Bearish and Bullish Targets Clearly Defined A Gap opens at $12,349.25 Bullish Breakout The minor consolidation referenced in our previous technical outlook has been broken to the upside and is trading above the Fibonacci 50% level. For Bulls, the next target to watch is the Read More…

commodity market and convenience yield
Market Overview Technical Analysis

Crude Oil Futures (CL) Breaks Below Consolidation Zone

The consolidation zone is broken to the downside Four consecutive red candles forms on the monthly chart Bears targetting $78.49 Monthly Candles September candle has opened red, forming the fourth monthly red candle in a row so far. We can connect a trend line from the November 2nd low to the December 1st low, which Read More…

Crude oil (CL) futures
Fundamental Analysis

Crude Oil (CL) Futures: Slight price recovery amid Russian Threat to Europe

The EU proposes price caps on Russia’s oil and gas exports. Britain’s PM Liz Truss is expected to repeal the nation’s fracking ban. China’s monthly crude oil imports dropped, fueling demand concerns. Crude Oil (CL) futures prices increased by as much as $1 per barrel on Thursday after falling in the previous session. An energy Read More…

gold futures
Strategies Technical Analysis Trading Tips

Technical Outlook on Gold Futures (GC)

Major Support Zone Proving to be strong on the Daily chart Downtrend Channel on the 2-hourly chart Potential 1-2-3 Reversal pattern on Daily Chart What Has Happened? Since August 31, we expected some strong support around the $1,715.3 level; we have seen that play out now with bids coming in the past week as the Read More…

Nasdaq 100 index futures (NQ)
Technical Analysis

E-mini Nasdaq 100 (NQ): Head and Shoulders Pattern Completed

Head and shoulders (H&S) target hit RSI indicates selling pressure is weakening Cautiously bearish on NQ Refer to our analysis on August 30 for a detailed explanation of the Head and Shoulders  (H&S) pattern formed on NQ which has been met. Normally, these patterns may get very close to the full target before consolidating or Read More…