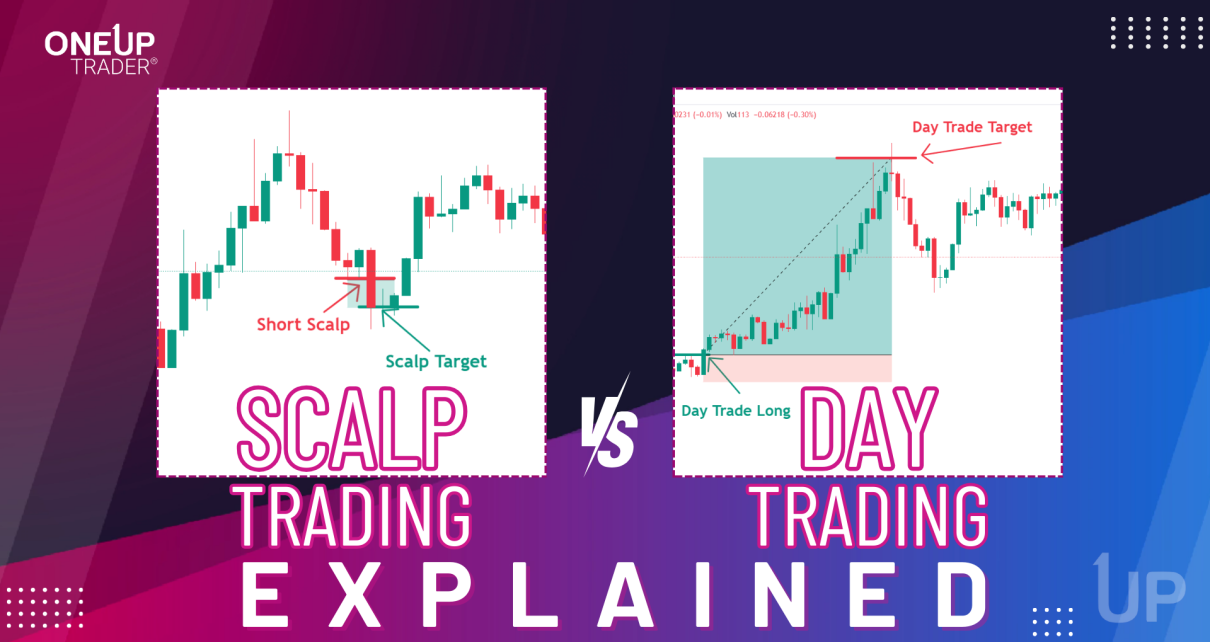
On Monday, US equities closed slightly lower as investors anxiously awaited a crucial inflation reading that could influence the duration of high interest rates by the US Federal Reserve. Following a strong rally on Friday, attention shifted on Monday to the Consumer Price Index (CPI) data scheduled for release on Tuesday morning. US CPI (Source: Read More…
Tag: E-mini S&P 500 (ES)
Are Equities Too Hot Right Now? Nasdaq Technical Analysis
Intro NQ has rallied 9% in a little over a week and is now only 4% away from all-time highs. With all the geopolitical mentions going on around the world it just shows that markets are 100% completely disconnected from reality. We are living in a ‘fake’ time and nobody is considering the risks that Read More…
Equities Climb as Investors Await Fed Guidance
On Monday, US equities inched higher as investors looked for guidance from various Federal Reserve policymakers later in the week regarding the central bank’s policy direction. S&P 500 weekly change (Source: Bloomberg) Last week, equities recorded their most significant weekly percentage gain in nearly a year due to a weaker-than-expected US payrolls report, which led Read More…
S&P 500 Futures (ES) Surge 5.8% last week
Introduction Equities surged last week as the Federal Reserve’s decision to hold interest rates steady in November marked the second consecutive meeting without a rate hike, following 11 hikes this year. Chair Powell stressed that while risks of undershooting or overshooting inflation targets have balanced out, no rate cuts are on the horizon. Markets don’t Read More…
Is Gold Hitting All-Time Highs This Year?
Gold Prices Eyeing All-Time Highs After Recent Rally Gold futures have seen a strong rally over the past few weeks, bouncing off a critical support level and now approaching all-time highs. GC is currently trading around $2010 after hitting a low of $1832 just three weeks ago. This bounce of over 8% off the lows Read More…
Are The NASDAQ Futures (NQ) Over Sold? Technical Outlook
The market plunged last week, taking out key support levels as the daily chart resembles a rounding top formation. From here, the market still looks bullish in the medium to long term, but let’s take a look at the technicals and levels to watch for this week. You can see the $14,700 level, which was Read More…

