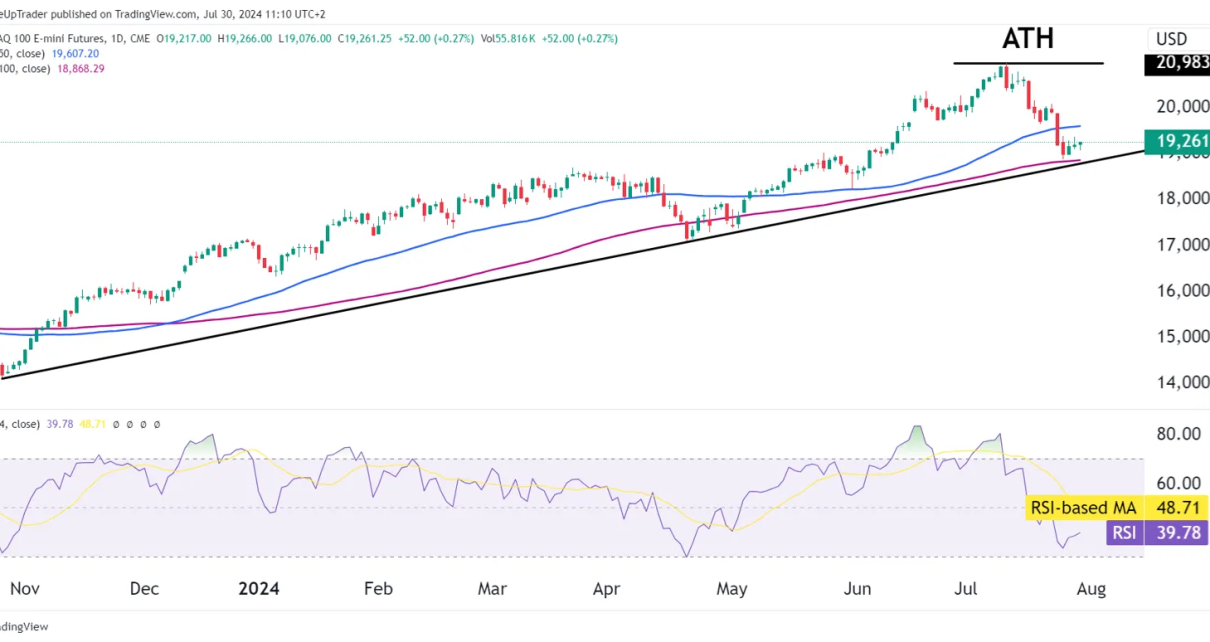
Nasdaq 100 index futures (NQ)
Technical Analysis

Nasdaq Futures chart poised for surge in bullish sentiment

The double bottom chart pattern is still in play from last week’s analysis. What happens if NQ does break below $12,200? Double bottom within double bottom can be seen on the smaller time frames. Technical recap Last week Monday, I stated how we can likely see a rally out of the support zone at $12,352. Read More…

nasdaq futures
Technical Analysis

Double bottom on Nasdaq (NQ) futures give bulls upper hand

A double bottom on the daily chart is driving bullish sentiment. Different entries and targets we can aim for and why shorts trades should be ignored for now. How can we use a simple stochastic entry method in a shorter time frame. Technical Analysis Double Bottom: NQ made a bottom back in October of last year, Read More…

nasdaq futures
Technical Analysis

Nasdaq futures (NQ) soar on back of Powell speech

The Fed raised interest rates by 25 basis points, sending equity markets higher. Technical analysis point toward a strong bullish bias. Utilizing the stochastic indicator to enter into trades on retracements. The Fed The Federal Reserve raised its key rate by a quarter point Wednesday, bringing it to the highest level in 15 years as Read More…

Nasdaq 100 index futures (NQ)
Technical Analysis

Nasdaq Futures (NQ) Sink After Trend Line Test

Price finds resistance at the year-long trend line once more. Yesterday’s session forms a bearish candle, but bulls appear to still be in control. Why the market rally we have seen recently is purely fundamental. Year Long Trend Line Strikes Again The trend channel we have discussed so many times in the technicals has proven Read More…