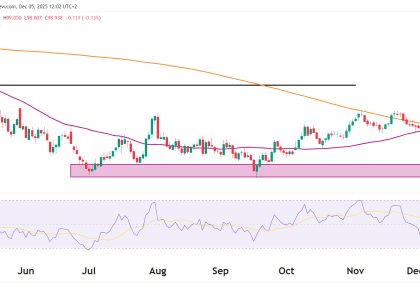
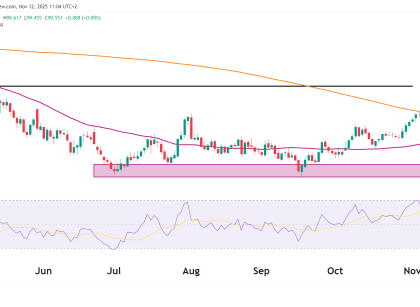
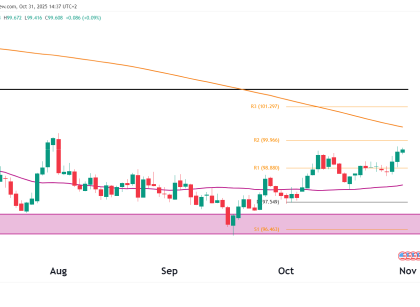
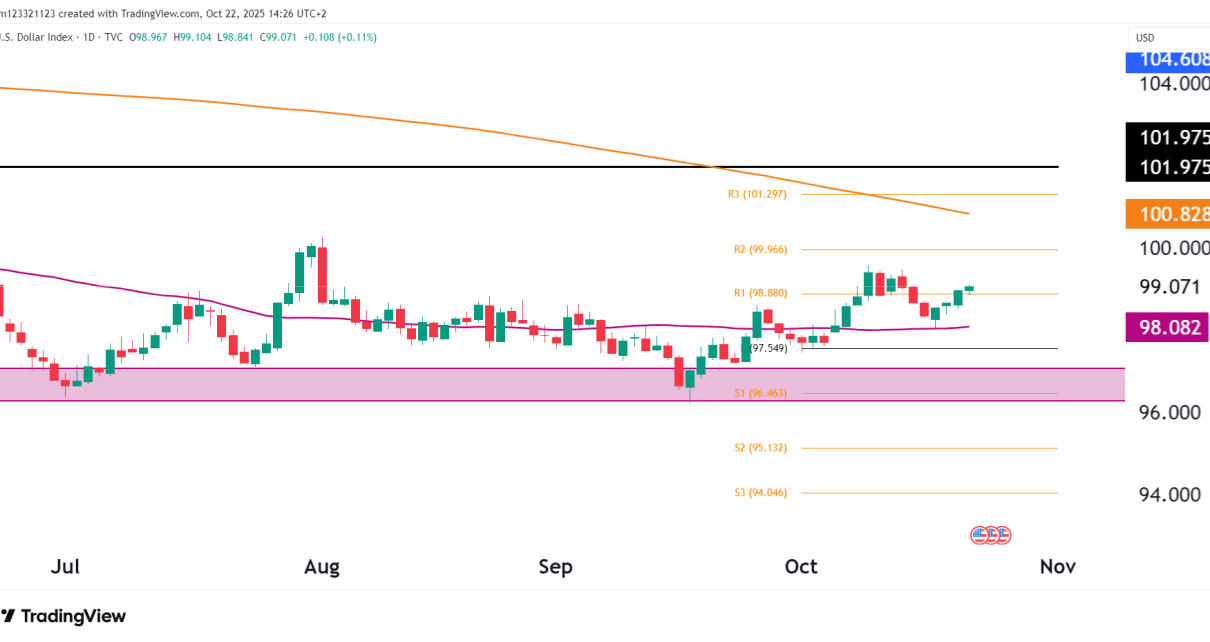
Dollar daily chart
Technical Analysis

U.S. Dollar Index (DXY) – Dollar Holds Firm Near 99

Introduction The U.S. Dollar Index (DXY) edged up 0.11% to 99.07 on Tuesday, showing signs of steadying after last week’s drop. It’s still holding above key support, with buyers trying to keep momentum going despite mixed U.S. economic data and changing views on Fed policy. Let’s take a closer look at the technicals.. Technical Overview Read More…
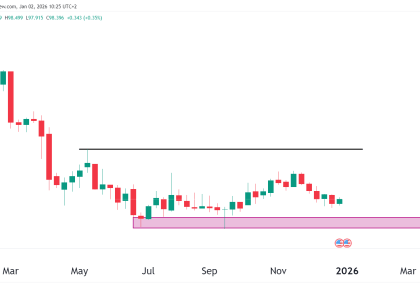
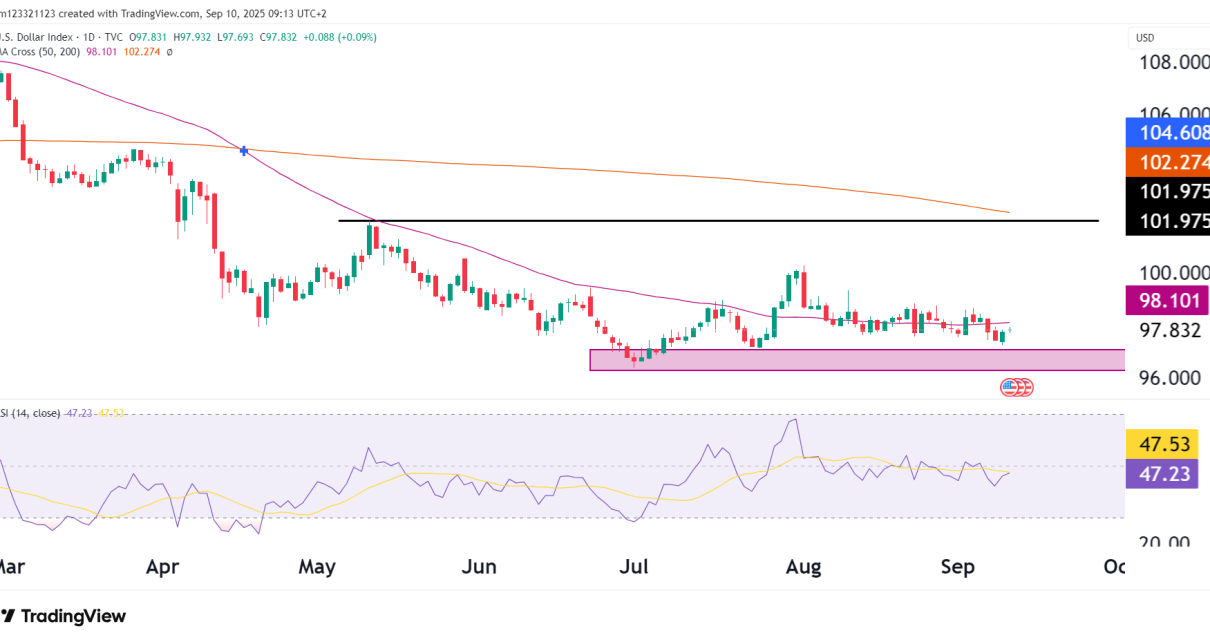
Dollar index
Technical Analysis

U.S. Dollar Index (DXY): Technical Analysis, Still Range-Bound

Introduction The U.S. Dollar Index (DXY) has begun flattening after peaking back in January of this year. It appears to have found a floor at least for the moment between 96.5–98.5 after its steep decline earlier this year of 12.5%. While the downside pressure has eased, the index has yet to show signs of a Read More…

Technical Analysis

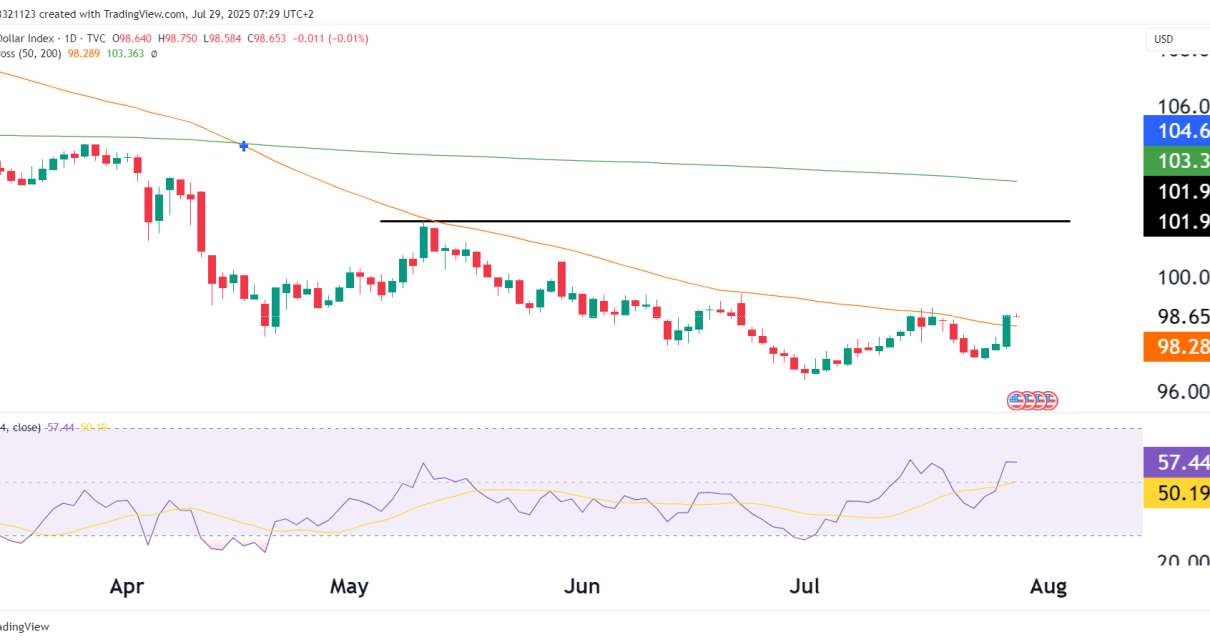
Dollar (DXY) Technical Analysis July 29

Current Price: 98.653Daily Change: −0.011 (−0.01%)Key Resistance: ~101.975 (horizontal)50-day MA: 98.289 (currently being tested)200-day MA: 103.363RSI (14): 57.44 (neutral-bullish) Technical Structure RSI & Momentum Interpretation This recent push through the 50-day moving average and the uptick in RSI show that short-term sentiment has improved for the U.S. dollar. However, this is happening within a broader Read More…

Technical Analysis

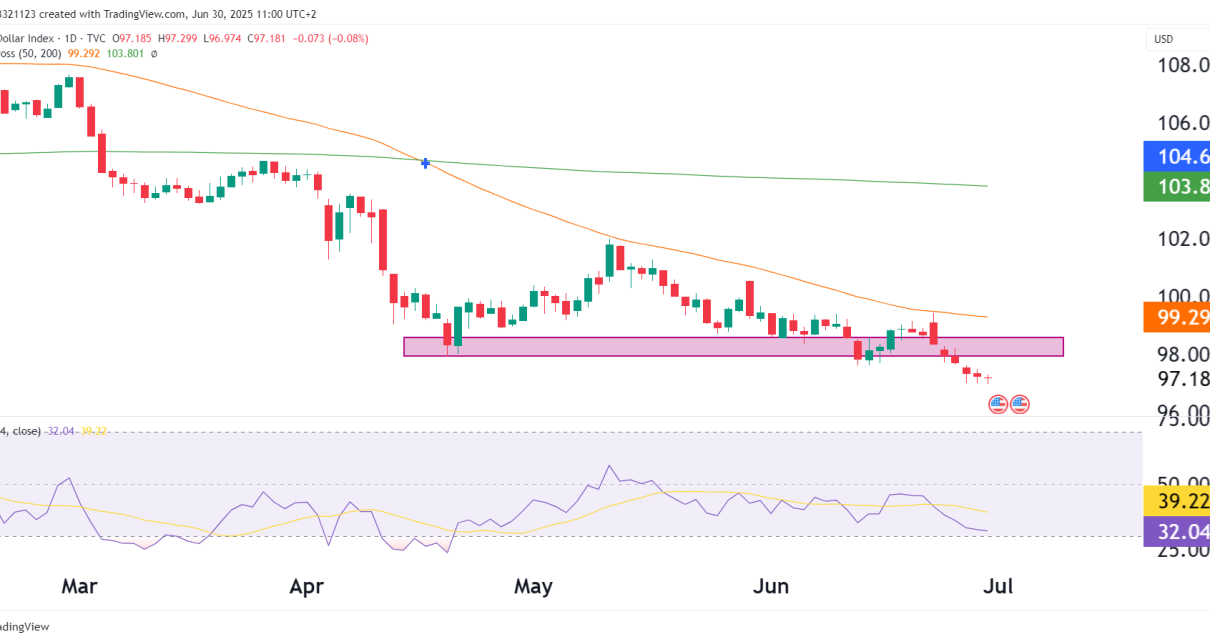
Dollar Slide Continues: DXY Technical Analysis

Introduction The U.S. Dollar Index (DXY) continues its slide, slipping further below the 97.80–98.50 support zone. With the RSI sustaining below 50 and moving averages trending down, the USD is under growing pressure as macroeconomic and geopolitical currents erode demand for the greenback. Technical Breakdown Metric Information Price 97.18 Key Breakdown Below ~98.00 support zone Read More…

Technical Analysis

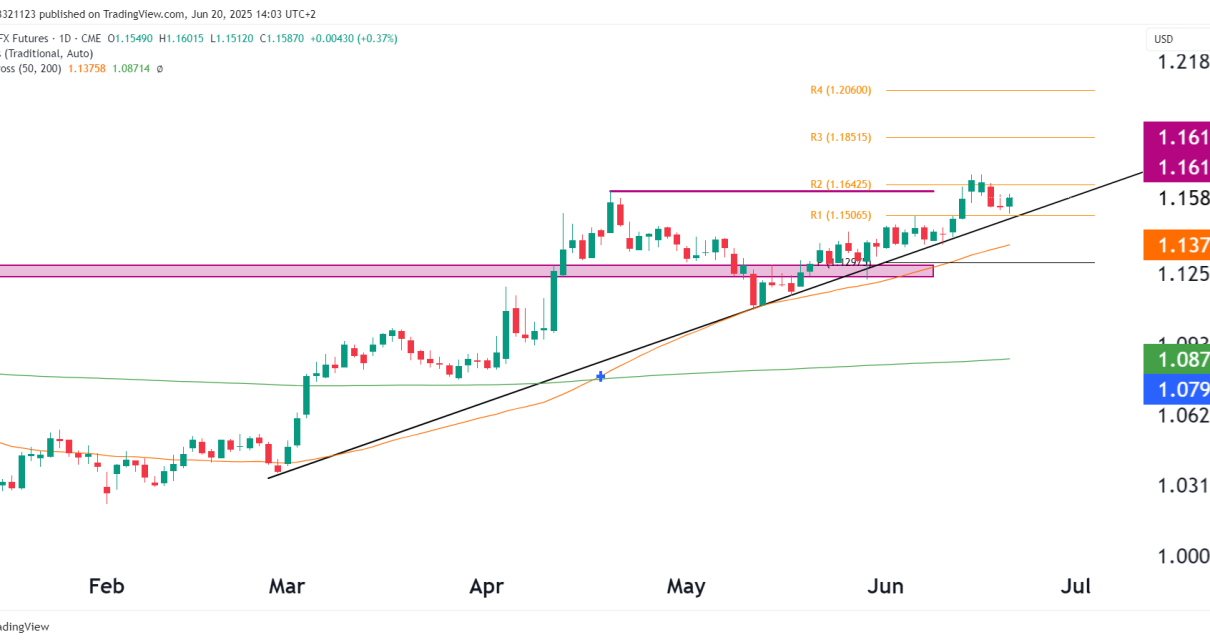
Euro Futures (6E) Technical Analysis, 20 June 2025

Euro FX Futures (6E1!) continue to follow a steady uptrend, now trading at 1.1587 and holding firmly above a rising trendline that has acted as reliable dynamic support since early March. The price remains comfortably above both the 50-day MA (1.1376) and 200-day MA (1.0871). The Dollar continues its decline as the political scene in Read More…

Fundamental Analysis Technical Analysis

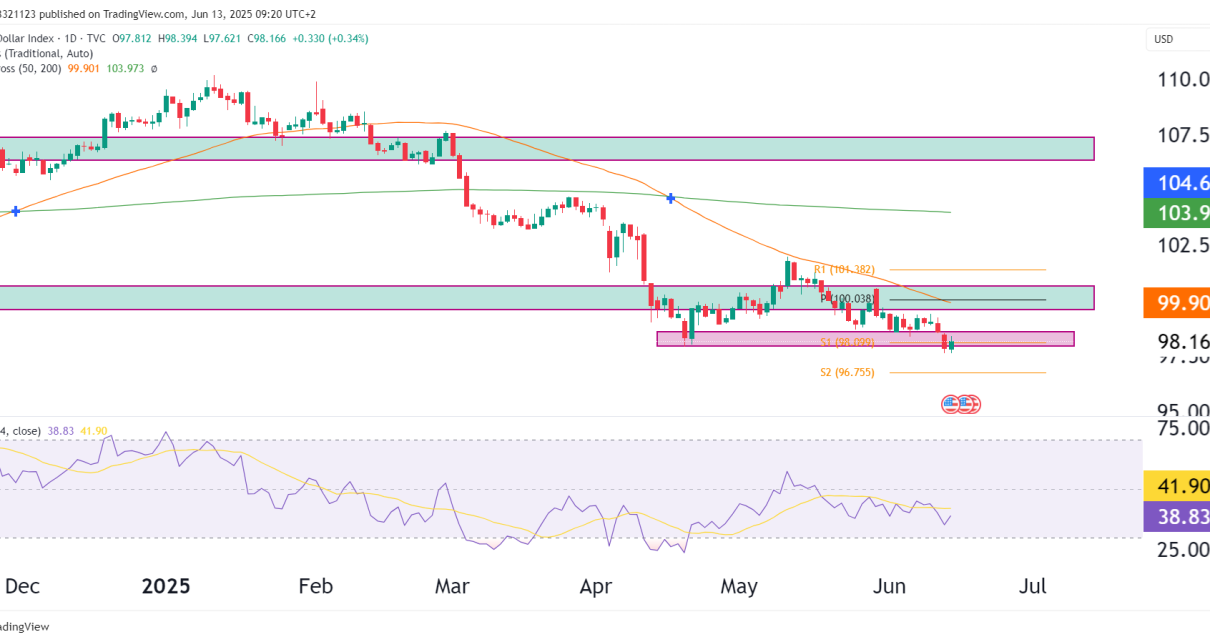
Dollar Technical Analysis – What’s Driving the Decline?

Price Action & Momentum Technically, DXY is in a confirmed bear trend. A sustained close below 97.93 would expose the 96.75 level next (S2). Reclaiming 100 would be necessary for bulls to regain control. Macroeconomic Pressures on the U.S. Dollar Rate Cut Expectations Soften Yield Appeal Twin Deficits – Fiscal and Current Account Political Uncertainty Read More…