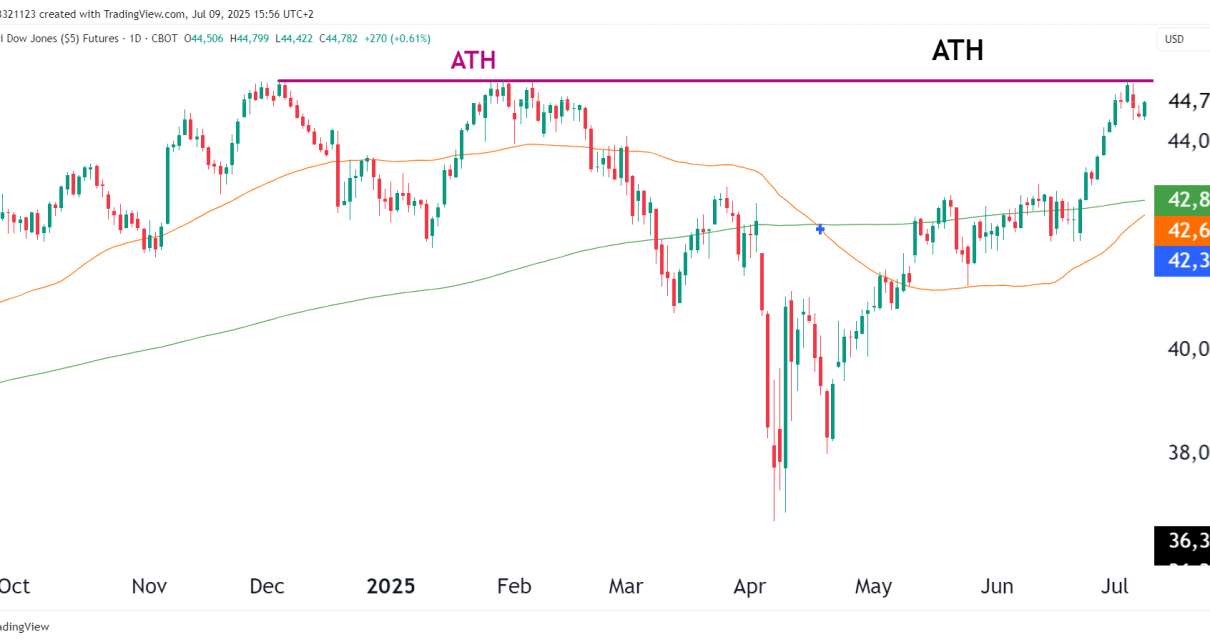
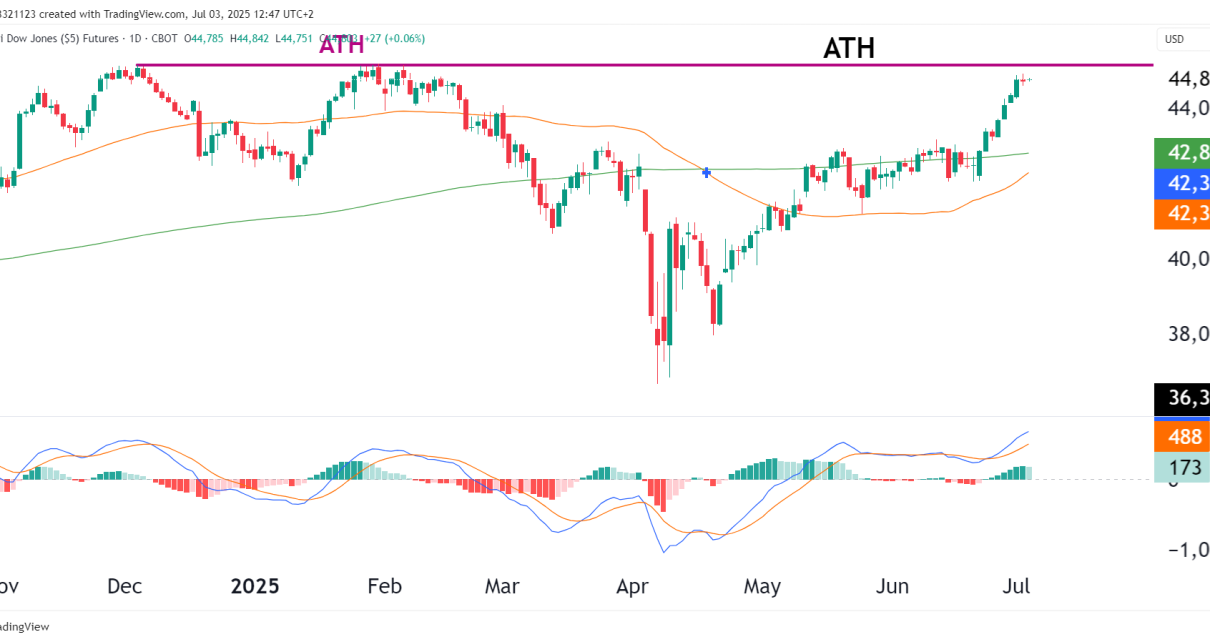
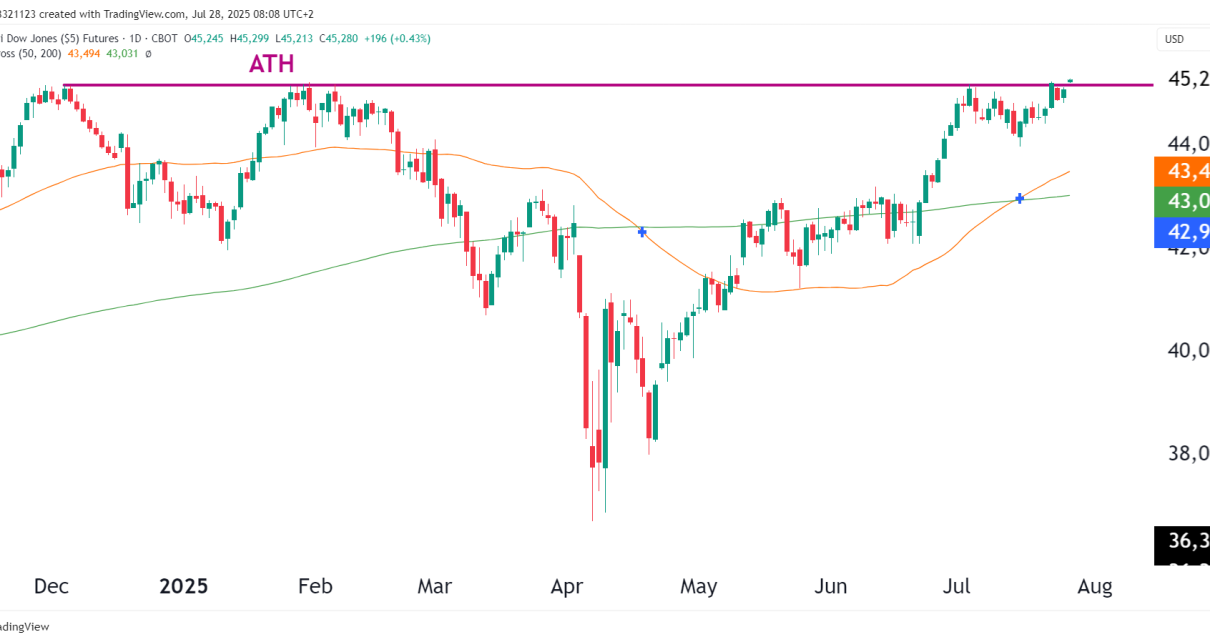
Technical Analysis

Dow Jones futures coiling up for a bullish break out

Pole & Triangle formation showing a strong potential rally is on the cards. Gaussian channel providing long entries on pullbacks for bulls. Macd confirms a period of consolidation. Technical Indicators Pole & Triangle: There was a strong rally before the triangle started forming. During this period of consolidation (Triangle), price has moved sideways, and this Read More…

Technical Analysis

How the Dow Jones Futures (YM) have diverged from the rest of the market

Breaking down how the dow jones diverged from other market indices last year. Analyzing the symmetrical triangle formation on the daily time frame. A true story about a trader who turned $5,000 into $15,000,000 in seven years. Quick Breakdown The Dow has been trading sideways for the majority of this year, remaining unchanged so far. Read More…

Market Overview Technical Analysis Trading Tips

Dow Jones Futures (YM) Now Only 6% From All-Time Highs

The Dow Jones continues to diverge from the rest of the market Bearish divergence has been spotted on the daily chart Bull and Bear targets YM Continues To Rally The Dow continues to diverge from the rest of the market as it is now only 6% away from all-time highs. YM is up 10% in Read More…

Market Overview Technical Analysis

Technical Outlook: Dow Jones (YM) Futures Prices Continue to Rally

A closer look into the Parabolic channels. Consolidation on the hourly chart could break in either direction. Parabolic Channels With parabolic channels, we take the same approach when drawing the main parabola; we need at least 3 points to make the connection. I’ve marked the main parabola in the image below with the connection points. Read More…

Market Overview Technical Analysis

Technical Forecast: E-mini Dow (YM) Futures Overbought & Decorrelated

The E-mini Dow has been decorrelated from the overall market this month. The Daily chart shows overbought condition. A small bear flag pattern appears on the Hourly chart. The Dow’s Decorrelation The Dow Jones (YM) Futures has been completely decorrelated from markets for the past month. NQ has fallen by 1% this month, while YM Read More…

Market Overview Technical Analysis

Dead Cat Bounce on the E-mini Dow (YM)?

YM Bounces Out Of Major Support Fibonacci Moving Average Analysis Spinning Top Candlestick From Yesterday’s Session A possible Dead Cat Bounce? YM Bounces Out Of Major Support The E-mini Dow (YM) traded inside the support band between $28,688 and $29,692. This area is within the accumulation zone and topped back in 2020. The rumors that Read More…