Price action trading is one of retail trader’s and investors’ most popular trading techniques. It involves analyzing an asset’s price movements on a chart to identify trade opportunities, without relying on technical indicators. Mastering price action can take time, but the basic principles are straightforward enough for beginners to understand. This guide will cover the basics for you to begin price action trading.
What is Price Action Trading?
Price action trading involves analyzing an asset’s price movement over time to identify patterns and make trading decisions. Rather than using technical indicators like moving averages, price action traders rely on the asset’s price chart itself. Instead of using technical indicators to look for overbought, oversold, buy, or sell zones, price action trading typically involves no indicators at all. Traders learn to ‘read’ the chart by analyzing the candlesticks and chart patterns such as triangles, converging patterns, double tops, and more.
Some of the key assumptions behind price action trading are:
- Price reflects all available market information. The asset’s price has built into it everything that is known about the market and asset.
- Price moves in trends and ranges. Charts tend to move in directions that persist for a period of time rather than randomly.
- History tends to repeat itself. Specific price patterns are likely to produce similar outcomes when they occur.
Price action traders aim to predict future movements by studying previous price movements and patterns. Common price action strategies include trend, range, and momentum trading.
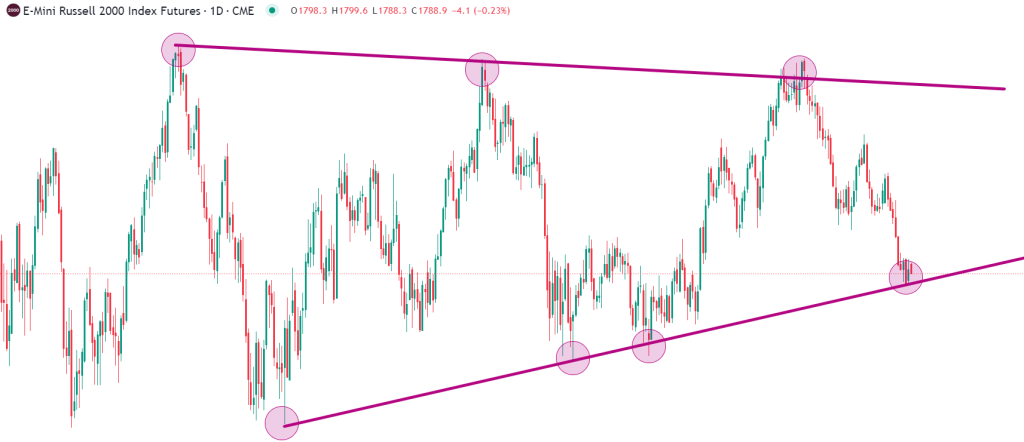
In the chart below, there is a converging range pattern. Price action traders would identify this pattern and trade it by selling short when price reaches the top of the range and buying once price reaches the bottom of the range (signaled by the circles). There are no indicators needed whatsoever, and the expectancy of each trade is high because, for example, if a trader takes a short position at the top of the range, the profit target could be set at the bottom of the range, which provides a considerable risk to reward ratio. Stop losses, in this case, would be placed above the range.
Why Use Price Action Trading?
Here are some of the main benefits of price action trading:
- Simplicity – Relies on raw price data rather than derived indicators. Easy for beginners to understand.
- Effectiveness – Strips out noise and focuses on the core driver of markets: price.
- Flexibility – Can be used across any market and time frame.
- Low Cost – No need for expensive charting packages or numerous technical indicators.
For these reasons, price action is appealing to beginners. The principles are straightforward to learn, yet retain relevance even for experienced traders. Even if a trader does not want to make price action their main go-to strategy, it is still highly recommended for all traders to learn price action; some would say it is vital. Without a good understanding of price action, it is difficult to interpret market moves and make trading decisions accordingly.
How to Trade Price Action: 4 Key Strategies
Now that we’ve covered the basics let’s look at some specific price action trading strategies:
1. Trend Trading
Trend trading aims to capture gains from sustained momentum in a particular direction. The central concept is to trade in the direction of the trend on higher time frames, rather than trying to predict reversals. Trend trading is simple to understand but can be challenging to implement without solid exit rules because positions can end up being held on for too long, and trader gives us the profits they have earned by not exiting the position.
Some of the critical tools for trend trading with price action include:
- Higher highs and higher lows (uptrend)
- Lower highs and lower lows (downtrend)
- Moving averages to identify the trend direction
- Volume to confirm the strength of the trend
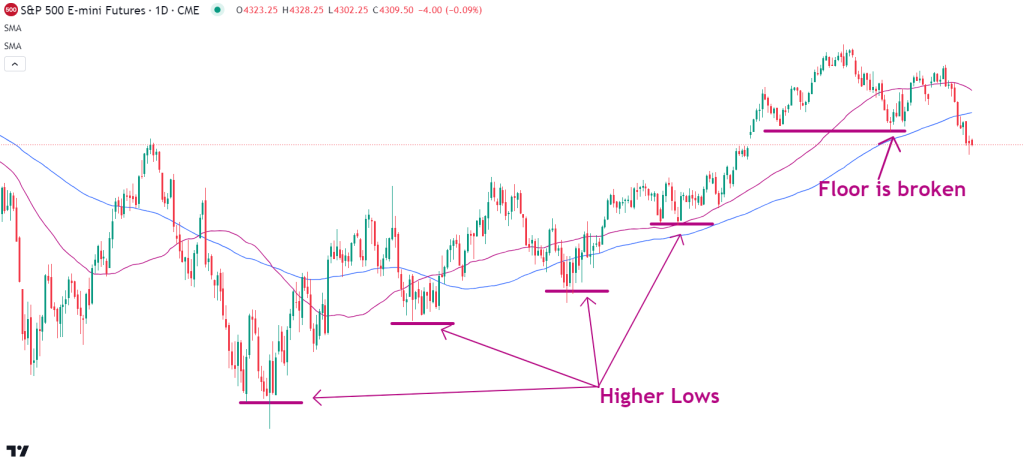
In the chart below, higher highs and higher lows are made, and each time price makes a new higher low, it forms a ‘floor’ that price remains above. Once that floor is broken, it means that the trend is over since it has not made a new higher low. If a trader notices this, it is an obvious signal to not buy any longer, but instead look to exit the position.
2. Range Trading
Range trading involves identifying support and resistance levels that bind an asset’s price movement. When the price nears support, the trader buys. When it approaches resistance, they sell.
Some range trading tactics using price action:
- Horizontal support and resistance markers
- Volume at support and resistance to confirm levels
- Price rejection candles (e.g., shooting star, doji)
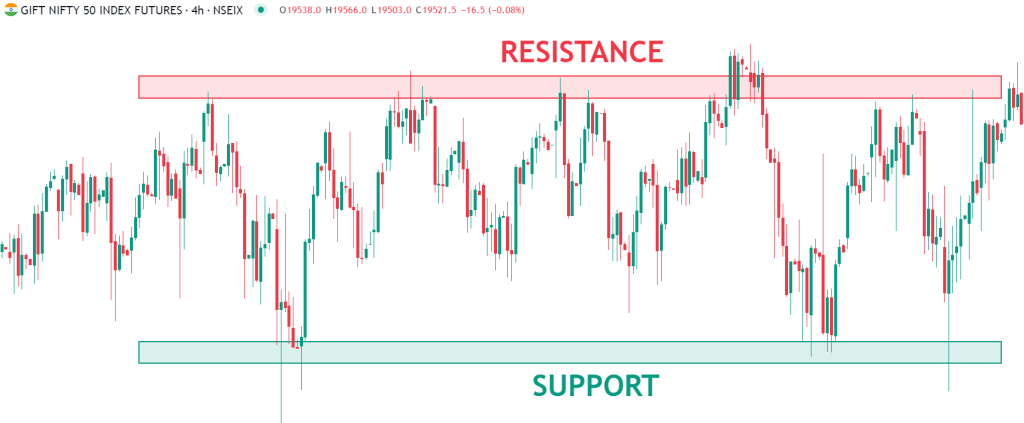
In the chart below, a range-bound strategy would involve buying at the support level, placing a stop loss below the low, and selling at the resistance level.
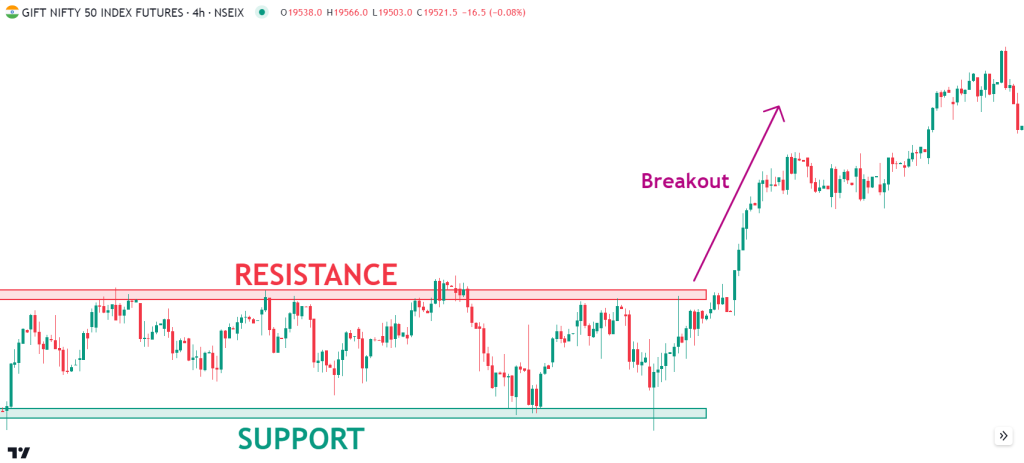
3. Breakouts
Breakouts aim to trade new trends early by identifying potential trend start points. Two main types of breakouts:
Range breakouts – When price breaks above resistance or below support
Pattern breakouts – When price breaks out of identifiable chart patterns like triangles, flags, etc.
To trade breakouts with price action:
- Draw key support and resistance levels
- Spot chart patterns like wedges and channels
- Use volume to confirm true breakouts
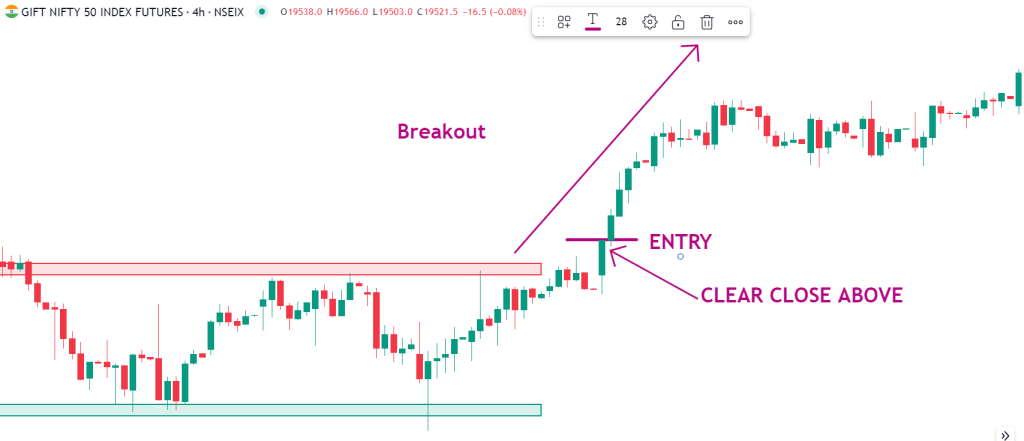
Breakouts can lead to huge profits quickly, but the main issue is knowing when to get in because sometimes the market can skyrocket with no chance of entering. The example below is the same chart we used for the range-bound trading strategy example. If a trader predicts that there will be a bullish break, he can place a buy limit order above the resistance level. This is a risky strategy because there can be a lot of fakeouts, meaning the price breaks out in the desired direction but does not follow through and ends up falling back down toward the support level. To counter this flaw of the entry system, traders can, depending on the time frame used, wait for a clear close above the breakout. The higher the time frame, the easier this becomes. The lower the time frame, the more difficult this is.
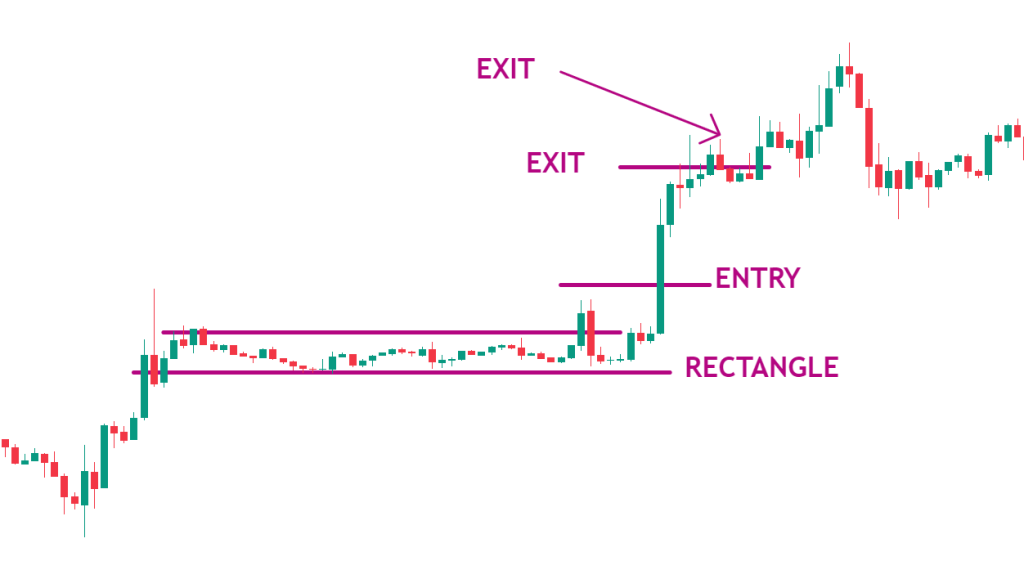
4. Momentum Trading
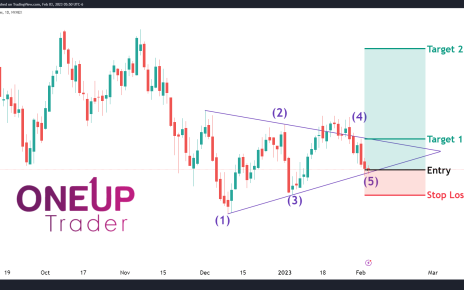
Momentum trading aims to take advantage of accelerating price movements and continuation patterns. Traders will try to isolate moments when breakouts and trends start to pick up pace. Flags, pennants, wedges, and rectangles are all examples of continuation patterns. The main difference between momentum trading and trend trading is that in momentum trading, traders aim to capitalize on the quick movements of markets without necessarily holding for the entire trend. A trend trader might look at entering on a deep pullback, while a momentum trader may only look at entering in the same direction once the confirmation that the trend will continue presents itself. Also, momentum traders often have tighter stop losses because they are trying to predict the direction and time it as well, which means they don’t want positions to run against them much at all in the beginning. This is illustrated in the chart below.
Some momentum concepts using price action:
- MACD and RSI as momentum indicators
- Volume spikes to identify momentum
- Gap openings signal momentum.
- Flags, pennants, and channels showing bouts of momentum
Well-timed momentum trades allow profits from existing trends to be maximized.
Ending Off
There are many different ways to trade markets, but price action trading is one that, as they say, is ageless. Price action is a fundamental skill every trader and investor must learn, even if they apply other strategies that don’t necessarily analyze price action. Without objective knowledge of price action, traders can get caught in the trap of trading from hope instead of analyzing the chart’s price action and making decisions accordingly. It is strongly recommended to study price action and thoroughly understand the mechanics involved.