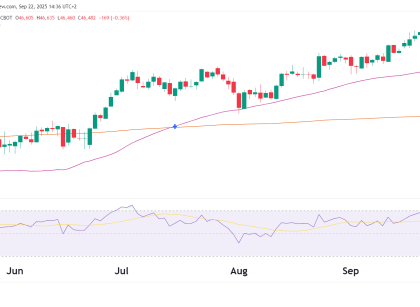
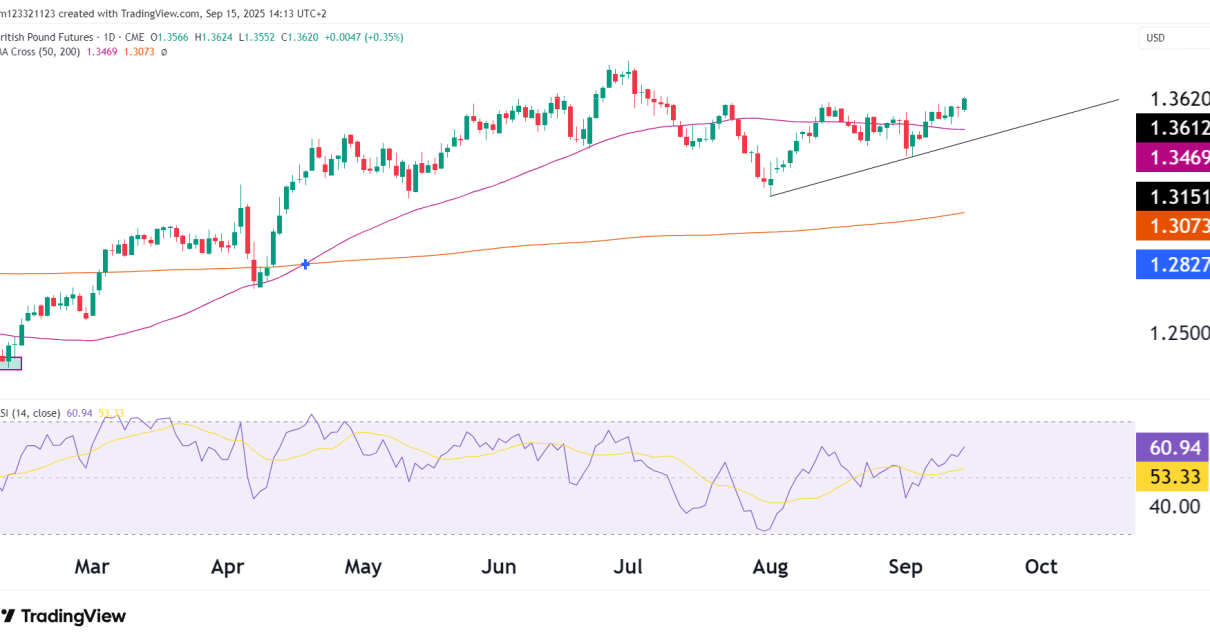
Trend Structure Key Support Levels Level Comment 102,720 (Pivot) Immediate short-term support; being tested. 95,095 (S1) Stronger horizontal 85,060 (S2) Lower support level of the channel uptrend. Resistance Levels Level Comment 110,150 (ATH) Psychological and technical ceiling. 113,755 (R1) Short-term price rejection zone. 122,380 (R2) Upside breakout target post-ATH. Market Psychology Trade Setups Scenario A Read More…
Technical Analysis
Russell 2000 Lagging S&P 500, Technical Outlook 3 June 2025
RTY Underperformance Weekly Chart of RTY: Structure and Trend Bullish Observations: Caution: Daily Chart of RTY Moving Averages RSI (14) Structure Metric ES (S&P 500 Futures) RTY (Russell 2000 Futures) Trend (Weekly) Strong uptrend Sideways, potential reversal Proximity to ATH ~4% below ATH ~17% below ATH Daily Trend Bullish continuation Range/consolidation RSI Momentum (Daily) Above Read More…
Crude Oil Futures (CL) Technical Analysis, 2 June 2025
Technical Outlook Price Zones Moving Averages Bull and Bear Scenarios Bull Case Bear Case Trade Setups Range Breakout Buy Setup Range Support Bounce Outlook Summary Timeframe Bias Commentary Short-Term Consolidation Attempting breakout of range; test underway at $63 Medium-Term Neutral → Bullish MACD flip, but still under key MAs – breakout above $65 needed Long-Term Read More…
NASDAQ 100 Futures (NQ) Technical Analysis, 30 May 2025
Technical analysis Zones Bull & Bear Cases Bull Case (higher probability) Bear Case (moderate risk) Trade Ideas Breakout Buy Opportunity (Momentum Continuation) Support Bounce Buy (Mean Reversion) Trades to Avoid Final Outlook Timeframe Outlook Bias Commentary Short-Term Consolidation Neutral-Bullish Price digestion after strong run-up Medium-Term Uptrend intact Bullish Higher lows, reclaim of MAs, poised for Read More…
Technical Analysis Euro FX Futures (6E), May 29 2025
Price Structure & Technical Levels Momentum and Squeeze Probabilities Timeframe Bull Case Bear Case Probability Short-Term (1–2 weeks) Break above 1.1300 leads to quick test of 1.1450–1.1613 Failure at 1.1300 leads to pullback to 1.1198 and possibly 1.1120 Neutral-to-Slightly Bullish (55%) Medium-Term (2–6 weeks) Retest and hold of trendline, breakout toward 1.1720 Breakdown below 1.1180 Read More…
Dow Jones Futures (YM) Technical Analysis – May 27, 2025
Technical Analysis Structure and Trend Any clean break above the 200-day MA opens room toward the all-time high (~43,564). A bullish “golden cross” is not yet active, but a sustained breakout could tilt momentum in that direction. Probabilities Scenario Description Probability Targets Bullish Continuation Holds trendline and breaks above 200-MA High 42,557 → 43,564 (ATH Read More…


