Introduction
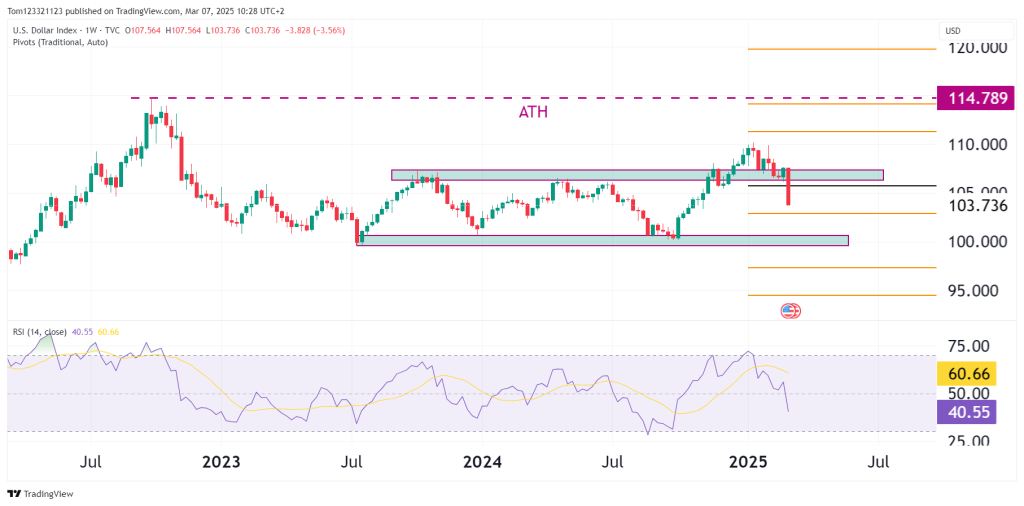
The U.S. Dollar Index (DXY) experienced a sharp decline, dropping 3.54% to 103.76, breaking below a support zone held since November 2024. The sell-off was triggered by a combination of fundamental factors, including recent macroeconomic data, shifting Federal Reserve expectations, and a controversial interview with former President Donald Trump that may have influenced market sentiment.
Key Fundamental Drivers Behind the Dollar’s Decline
1. Trump-Zelensky Interview Raises Concerns
- The market reaction to the Trump-Zelensky interview appears to be contributing to the risk-off sentiment against the dollar.
- During the interview, Trump’s comments on the Russia-Ukraine conflict were perceived as undermining U.S. foreign policy stability, leading to concerns over geopolitical risks.
- His stance, which some viewed as favorable to Russia, might have raised fears of weakened U.S. leadership on the global stage, causing investors to hedge into other currencies and safe-haven assets.
2. Shifting Federal Reserve Expectations
- Recent U.S. economic data showed mixed results, with cooling inflation and weaker consumer spending, leading to speculation that the Federal Reserve may pause or slow rate hikes.
- Fed officials have struck a cautious tone, suggesting that the end of the tightening cycle may be near, which has pressured the dollar as yield expectations declined.
3. Broader Market Sentiment
- The risk-on environment has favored equities and weakened the dollar, particularly as the euro and other major currencies gain strength on the back of hawkish central banks.
- The European Central Bank (ECB) remains committed to rate hikes, bolstering the euro, while the Bank of Japan recently hinted at a potential policy shift, boosting the yen.
4. Technical Breakdown Magnifies Selling
- The dollar index broke below critical support near 105.00, triggering stop losses and increasing selling pressure.
- The lack of support until the 100.00 area opens the door for a further decline, particularly if momentum remains strong.
Technical Analysis—Weekly Chart
1. Major Support Broken
- The dollar index fell through the support zone between 105.00 and 106.00, with strong bearish momentum.
- The RSI is at 40.62, indicating that momentum remains bearish, but not yet oversold, suggesting further downside potential.
2. Key Levels to Watch
- Next Major Support: Around 100.00, where the last consolidation zone lies.
- Resistance Levels: Any attempted rebound would likely face resistance at the 105.00 – 106.00 zone, now a key resistance.
Potential Scenarios Moving Forward
1. Continued Bearish Momentum
- If the dollar index maintains its current trajectory, a test of the 100.00 level is likely.
- The absence of strong support until this zone means that the path of least resistance remains downward.
2. Relief Rally Possible if Sentiment Shifts
- Should geopolitical fears ease or the Federal Reserve adopts a more hawkish stance, a relief rally could occur.
- The 105.00 – 106.00 zone would be a key target for any short-term bounce, but sellers are likely to defend this area aggressively.
Outlook Summary
- Short-Term (1-2 Weeks): Bearish, with a potential test of 100.00.
- Medium-Term (1-3 Months): Bearish unless the dollar recovers above 106.00, which seems unlikely given current sentiment.
- Long-Term (6+ Months): The dollar’s trend remains at risk, especially if global central banks continue tightening while the Fed remains cautious.