Technical Summary
- Chart Pattern Breakout: Ascending triangle (bullish continuation)
- Measured Move Target: ~6,170 (from 860-point range breakout)
- Key Resistance Ahead:
- 5,786.48 (200-day SMA)
- 5,802.00–5,830.00 (prior swing highs)
- Support Levels:
- 5,608 (50-day SMA)
- 5,465 (broken triangle resistance – new support)
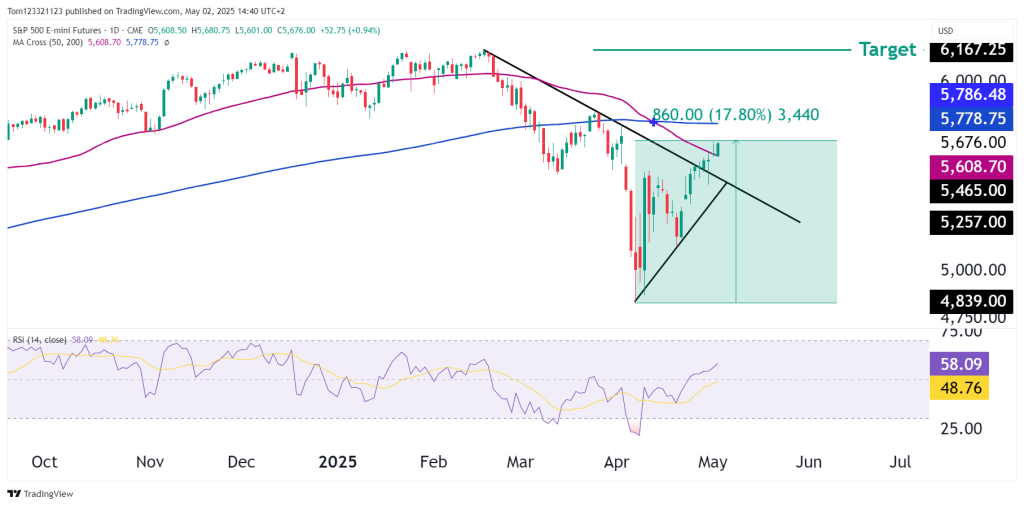
Chart Analysis
Pattern Development
- The descending trendline from the 2025 highs has now been broken to the upside, validating an ascending triangle pattern.
- The breakout occurred with strong momentum and sustained follow-through.
- The price action has already advanced ~860 points (~17.8%) from the lows, with RSI pushing near 58, confirming rising momentum.
Outlook
| Scenario | Probability | Technical Trigger |
|---|---|---|
| Continued breakout to 6,170+ | 60% | Clear path if 5,780–5,800 is reclaimed and held |
| Range-bound pullback first | 25% | Retest of broken resistance ~5,465 zone before resumption |
| False breakout and failure | 15% | Breakdown back below 5,465–5,400 with volume |
Bull Case:
- Ascending triangle breakout completed
- RSI rising with room to run
- Price now above 50- and close to testing 200-day SMA
- Broad macro positioning still risk-on: strong tech earnings + lower inflation
- Potential Fed rate pause or cut this summer could support upside continuation
Bear Case:
- Still below macro resistance (5,780–5,800); risk of bull trap
- Some divergences in small-cap breadth, and VIX at cycle lows
- If 5,465 fails on a backtest, bears may regain short-term control
- Geopolitical risks (e.g. tariffs, Middle East tensions) remain a wildcard
Final Take
This breakout is technically valid, supported by momentum, volume, and price structure. The measured move projection to 6,170 remains on the table as long as 5,465 holds as support.
While macro uncertainties remain, price action now favors the bulls, and dips are likely to be bought—especially if economic data softens just enough to justify Fed dovishness without confirming recession.
Timeframe
| Timeframe | Bias | Commentary |
|---|---|---|
| Short-Term | Bullish | Breakout confirmed, RSI supportive |
| Medium-Term | Cautiously Bullish | Needs reclaim of 5,780–5,800 to confirm full reversal |
| Long-Term | Neutral to Bullish | Depends on macro resolution and earnings durability |