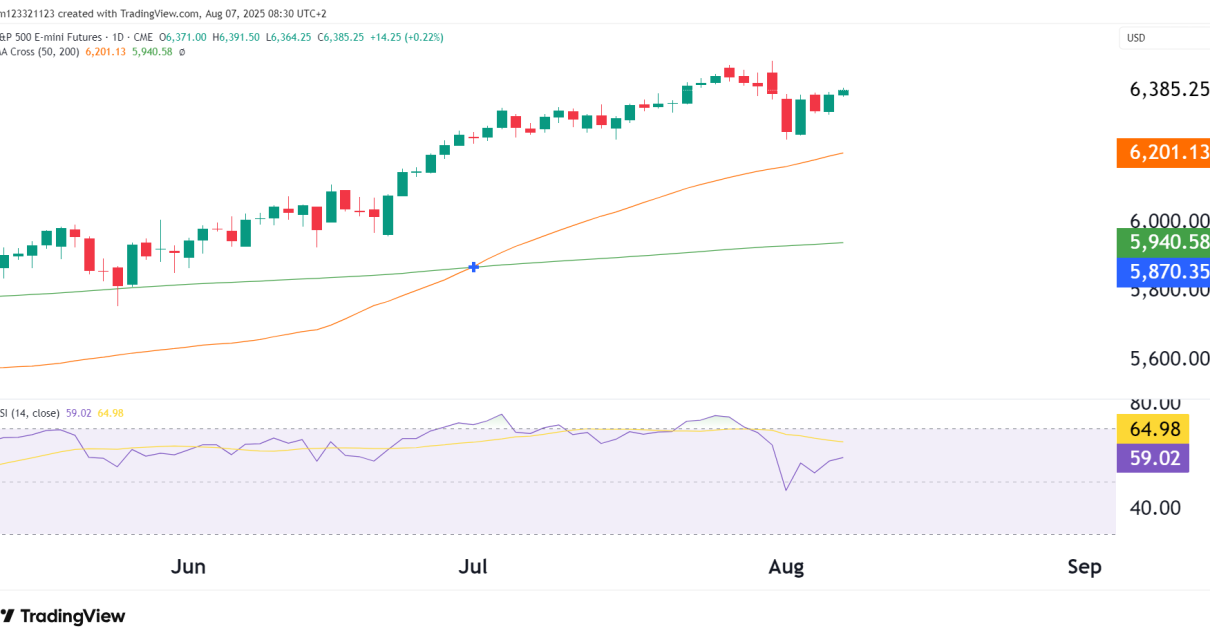
The uptrend remains intact with price trading firmly above both the 50-day and 200-day moving averages.
After a brief pullback last week, ES has posted three consecutive green candles, telling us the bulls are still in control.
The recent low around 6,290 is forming a higher low, which is strengthening the bull case even further.
Momentum & RSI
RSI has recovered to 59.02, bouncing from just above 50.
This momentum reset during the pullback helps cool prior overbought conditions and gives more strength for a move higher after that.
Key Technical Levels
Level
Type
Significance
6,450–6,460
Resistance
All-time highs zone
6,290–6,300
Support
Recent low and short-term demand zone
6,201
50MA
Strong trend support
5,940
200MA
Long-term trend floor
Probability Table
Scenario
Estimated Probability
Reason
Breakout above ATH (6,460+) this week
40%
Momentum building but needs catalyst
Consolidation between 6,300–6,450 continues
45%
Sideways consolidation after sharp move
Breakdown below 6,290 → retest of 50DMA (~6,200)
15%
Less likely unless macro shocks hit
Trade Setups
Bullish Setup
Entry: Close above 6,400
Target: 6,500+ (psychological and extension level)
Stop: Below 6,290 (last swing low)
Bearish Setup
Entry: Rejection at 6,450 followed by red candle below 6,300
Target: 6,201 (50MA)
Stop: Above 6,450
Ending Off
ES is recovering from a small dip which gave a small buying opportunity to traders. All US indices are rallying at this time and the dip was likely because of the recent recovery in the Dollar. Bulls remain in control and probabilities are pointing toward a move above all time highs once more.
Introduction There is bearish divergence playing out on the daily chart for Gold futures. The daily candle we see forming today (7 June) is a big red one as buyers become exhausted. Is gold’s run coming to an end? The chart provided is of Gold Futures (COMEX), with several technical indicators and patterns that can Read More…
Introduction Euro FX futures (6E) have been in a steady downtrend on the daily chart because of the strength in the US dollar after the escalations in the Middle East. Price is currently below an important support level, and a more worrying sign for the Euro bulls is that it is starting to act as Read More…
Technical Analysis Bullish trend channel: The bullish trend channel on the daily chart has now been officially broken. There are a lot of stop losses getting triggered at this point for the traders who went long. Traders who have banked a solid profit from the near 50% rally in NQ for the past 10 months Read More…

