


Introduction
The S&P 500 E-mini futures (ES) continue to consolidate below the all time high of $7,000. The sideways price action has been going on since October of 2025 with no real signs of it coming to an end any time soon. Even the escalation in the Middle East hasn’t touched the US equity markets much.
The overall trend is still bullish in the long term, and any dips can be bought up by those who are long-term bulls. With that said, there still needs to be a lot of attention paid to the developments in Iran as they could wildly swing markets, especially the Dollar and crude oil.
Current ES Market
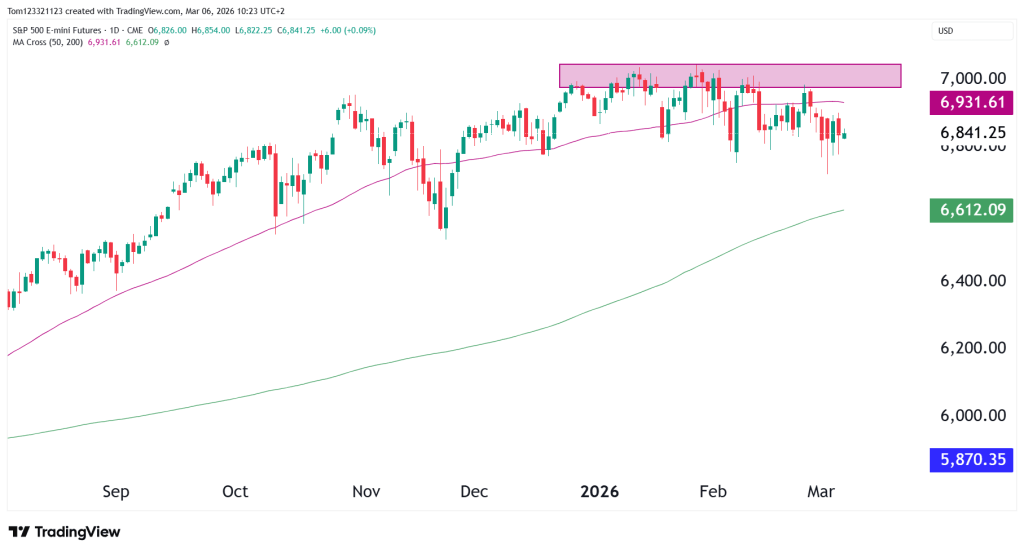
Recent price action shows that the market keeps getting rejected around the 6,950 to 7,000 area, which lines up with a clear supply zone on the daily chart. Each time price moves into that range, sellers step in and push it back down.
There have been several attempts to break above 7,000, but none have held. Since February, the chart has also started forming slightly lower highs, which suggests that upside momentum is slowing.
Price has also slipped just below the 50-day moving average, around 6,931, another sign that the short-term trend is cooling off. At the same time, buyers are still defending the 6,800 level, preventing a deeper pullback.
Looking at the bigger picture, the 200-day moving average near 6,612 is still trending upward, which shows that the longer-term trend remains positive.
Overall, this price action suggests the market is shifting from a strong bullish run into a period where buyers and sellers are starting to balance each other out. Instead of trending strongly in one direction, price may move sideways for a while as the market decides what comes next.
War Developments & Impact on Equities
Equity markets often react quickly to geopolitical tensions, especially when uncertainty starts affecting energy markets, supply chains, or overall investor confidence. When conflicts escalate, investors tend to reduce their exposure to risk assets and move capital into more defensive areas such as bonds, gold, and safe-haven currencies. This shift in positioning can lead to short-term selloffs in equities, even if the broader economy still looks stable.
Another factor is energy. If a conflict disrupts oil supply or key transportation routes, energy prices can spike. Higher oil prices can push inflation expectations higher and increase costs for businesses. That can pressure corporate margins and may also delay potential interest rate cuts from central banks, both of which tend to weigh on stock markets.
Geopolitical uncertainty can also affect market behavior more directly. Traders often increase hedging during these periods, volatility rises, and markets become more sensitive to headlines. As a result, index futures like ES can experience quick, sharp moves in both directions as new developments hit the news.
Market Structure & Trend
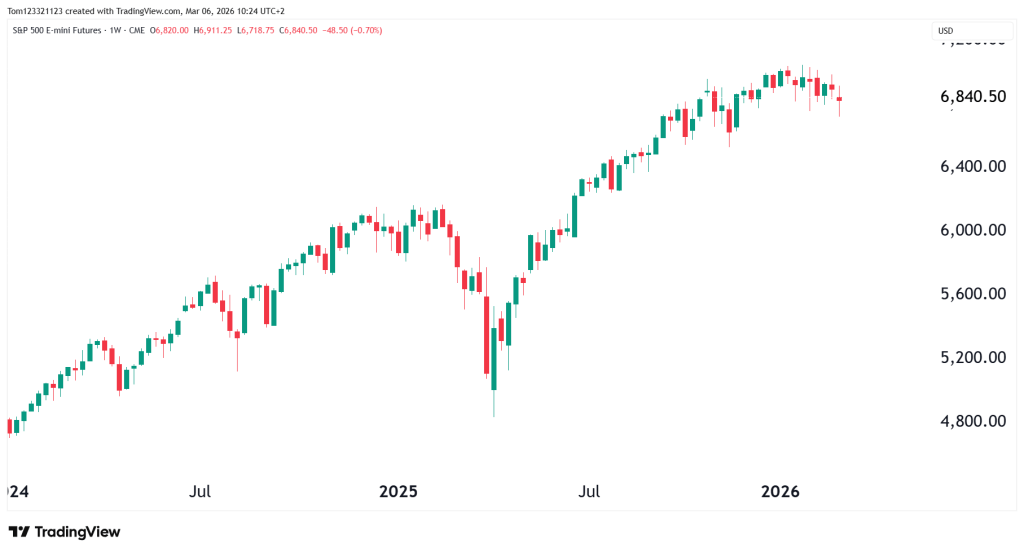
Weekly Chart – Macro Uptrend Intact
Key Technical Levels for ES
Resistance
6,950 – 7,000
- Major resistance zone
- Multiple rejection points
- Psychological resistance
7,200
- Next major upside target
- Projected move if resistance breaks
Support
6,800
- Current short-term support
- Recent reaction lows
A break below this level would likely trigger accelerated selling.
6,612
- 200-day moving average
- Major institutional trend support
6,400 – 6,450
- Previous consolidation region
- Potential deeper pullback target
Scenarios Going Forward
Bullish Breakout
If buyers regain control and macro sentiment improves:
- Price breaks 7,000 resistance
- Momentum buying enters the market
- ES targets 7,200–7,300
This would confirm continuation of the 2025–2026 bull trend.
Range Consolidation
Price continues oscillating between support and resistance:
6,800 – 7,000
Estimated Probability Table
| Scenario | Description | Probability |
|---|---|---|
| Range continuation | 6,800–7,000 consolidation | 45% |
| Bullish breakout | Move toward 7,200 | 30% |
| Risk-off pullback | Drop toward 6,600 | 25% |
Final Takeaway
S&P 500 futures are still in a strong long-term uptrend, but the market is having trouble breaking above the 7,000 resistance level.
Until that level is clearly broken, price will likely stay in a range between 6,800 and 7,000.
The next big move will probably depend on both technical signals and global news. Developments related to war or geopolitical tensions could quickly shift market sentiment, especially if they affect energy prices or the global economy.
For now, ES is trading just below a key resistance level, with the market waiting for a clear reason to move in either direction.
This analysis is for educational and informational purposes only and does not constitute trading advice or a recommendation to buy or sell any futures contracts. Futures trading involves significant risk and may not be suitable for all investors. Always conduct your own research and consult with a licensed financial professional before making trading decisions.