


Introduction
The S&P 500 E-mini futures (ES) began the week on firmer footing as buyers stepped in to defend the 6,575–6,600 support zone and the 50-day moving average. After a sharp selloff earlier this month, the index has started to find some extra buying pressure and is now pushing back to test all-time highs. In our previous analysis, the index had just dropped 3.5% in a single day, but bulls have managed to hold the price stable, so let’s take a closer look at the technicals and what they tell us.
Technical Overview
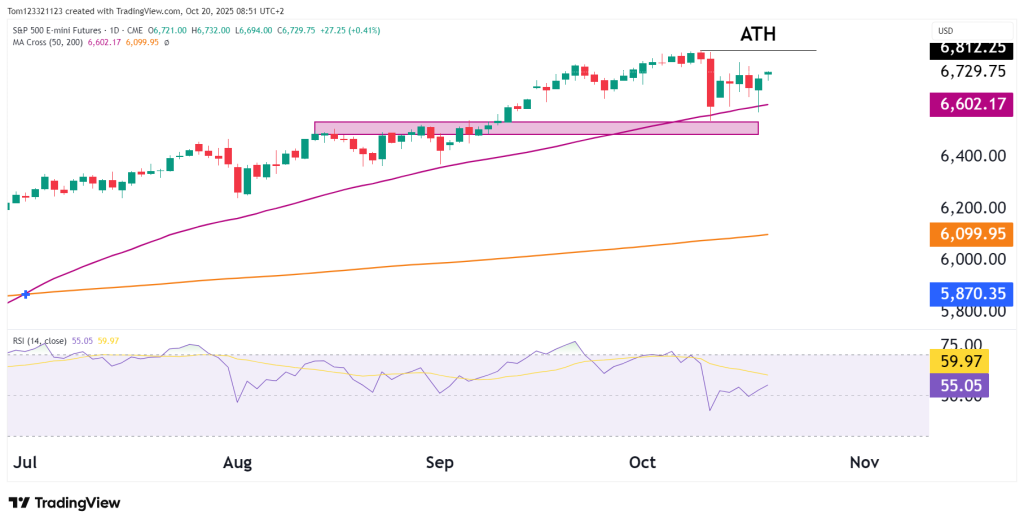
The daily chart shows price has bounced off a key support level, where the 50-day moving average lines up with the bottom of the previous breakout zone. This area was mentioned in earlier analysis as a possible spot for a rebound — and that bounce is now happening.
The move back above 6,700 adds strength to the short-term bullish trend. The next key level is the all-time high at 6,812. If the price breaks above that, it would confirm the uptrend is back on, with a chance to reach the next resistance near 6,900.
Meanwhile, the 200-day moving average is way down at 6,099, showing that the overall trend is still bullish, even with the recent dip.
RSI & Momentum
The RSI (14) has rebounded to 55.05, recovering from a dip below the 50 level. This supports the stabilized price action that we see on the chart and acts as an extra layer of confirmation.
Key Technical Levels
| Type | Level | Description |
|---|---|---|
| Resistance 1 | 6,812 | All-time high (ATH) |
| Support 1 | 6,575–6,600 | Prior consolidation zone / 50-day MA |
| Support 2 | 6,450 | Lower channel support / September swing low |
| Major Support | 6,099 | 200-day MA; long-term bullish threshold |
Probability Table (Next 2–3 Weeks)
| Scenario | Estimated Probability | Notes |
|---|---|---|
| Rebound and retest of 6,812 ATH | 55% | Bulls defending 50-day MA & momentum recovery. |
| Sideways consolidation above 6,600 | 30% | Possible if buyers lack conviction before earnings season. |
| Breakdown below 6,575 support | 15% | Would weaken short-term structure and expose 6,450. |
Fundamentals
Market sentiment has slightly improved after last week’s drop, helped by calming comments from U.S. officials that eased worries about long-term trade problems. Now, investors are focusing on upcoming Q3 earnings, especially from major banks and tech companies, which could influence the overall market.
Also, Treasury yields have leveled off, reducing pressure on stock prices, and the weaker U.S. dollar has given risk assets a bit of a boost. Still, there’s some uncertainty due to President Trump’s recent tariff comments and how they might affect global supply chains.
Summary
The S&P 500 E-mini futures are showing early signs of stabilization after defending support near 6,600. While the broader uptrend remains intact, the index now faces a decisive test near the 6,812 all-time high. A break above this level would reaffirm bullish control, while rejection could extend the consolidation phase.
Overall, momentum has shifted back toward the bulls, with a short-term path pointing upward — but traders should remain mindful of macro headlines and upcoming earnings volatility.
This analysis is for educational and informational purposes only and does not constitute trading advice or a recommendation to buy or sell any futures contracts. Futures trading involves significant risk and may not be suitable for all investors. Always conduct your own research and consult with a licensed financial professional before making trading decisions.

