


Introduction
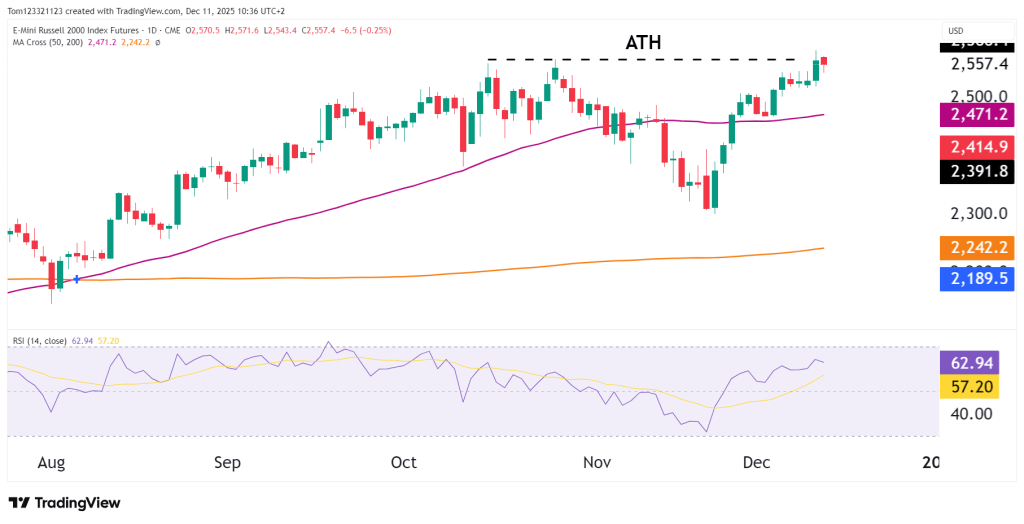
In the previous RTY analysis (2 December 2025), we highlighted that the Russell 2000 was attempting a recovery after rebounding from the 2,300–2,320 support area, with bulls aiming to retest the all-time high (ATH). Since then, RTY has continued to build on its momentum, with price rallying 11% from the lows made on the 21st of November. The ATH was tested and broken on the December 10 session, so the next few sessions will be important to see if the buying power is strong enough to continue with the momentum or if the resistance will be too strong.
Let’s take a closer look at the technicals and what they are telling us.
Technical Overview
Price Structure
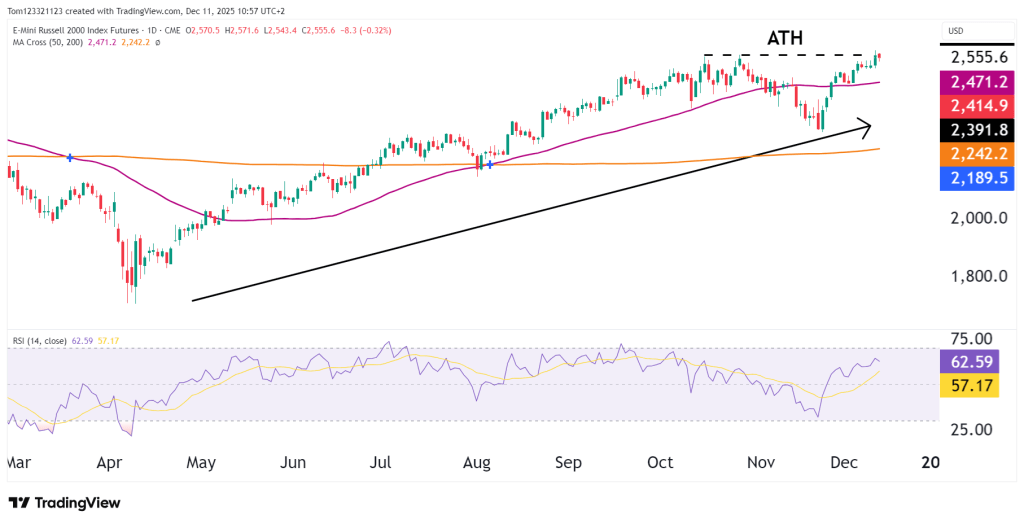
The rally since April has been strong and follows the rest of the US markets as RTY is up 50% since those lows. The price has remained above the 50 MA for most of the time, with it falling below it toward the end of November. Bulls have pushed the price back above it so from here it should act as support moving forward if the momentum continues.
Key Levels to Watch
- Resistance:
- 2,565 (ATH) – major, a breakout here would mark fresh price discovery.
- 2,580–2,600 – potential upper extension if ATH breaks.
- Support:
- 2,500–2,510 – first pullback zone; recent breakout area.
- 2,470 (50-day MA) – dynamic support.
- 2,390–2,415 – deeper support cluster from November lows.
Momentum
- RSI at ~63 signals firm bullish momentum without being overextended.
- Momentum has broken above the multi-week downtrend from October, confirming improving buying strength.
Probability Table (Next 2–3 Weeks)
| Scenario | Estimated Probability | Notes |
|---|---|---|
| Breakout above 2,565 ATH → continuation toward 2,600 | 50% | Price is pressing against resistance with improving momentum. |
| Consolidation between 2,500–2,565 | 35% | Common near ATH levels; bulls may regroup before next leg. |
| Pullback to 2,470–2,440 region | 15% | Only likely if broader risk sentiment weakens. |
Summary
RTY is back up against its all-time high at 2,565, a level that has stopped rallies several times recently. The trend looks stronger now, momentum is improving, and buyers have taken back the main moving averages, which all support the bullish case.
Still, nothing is confirmed until RTY breaks above 2,565 with conviction. A solid close above that level could push the index toward 2,600 and new highs. If it fails again, it could pull back toward 2,500 or even the 2,470 area.
This analysis is for educational and informational purposes only and does not constitute trading advice or a recommendation to buy or sell any futures contracts. Futures trading involves significant risk and may not be suitable for all investors. Always conduct your own research and consult with a licensed financial professional before making trading decisions.

