

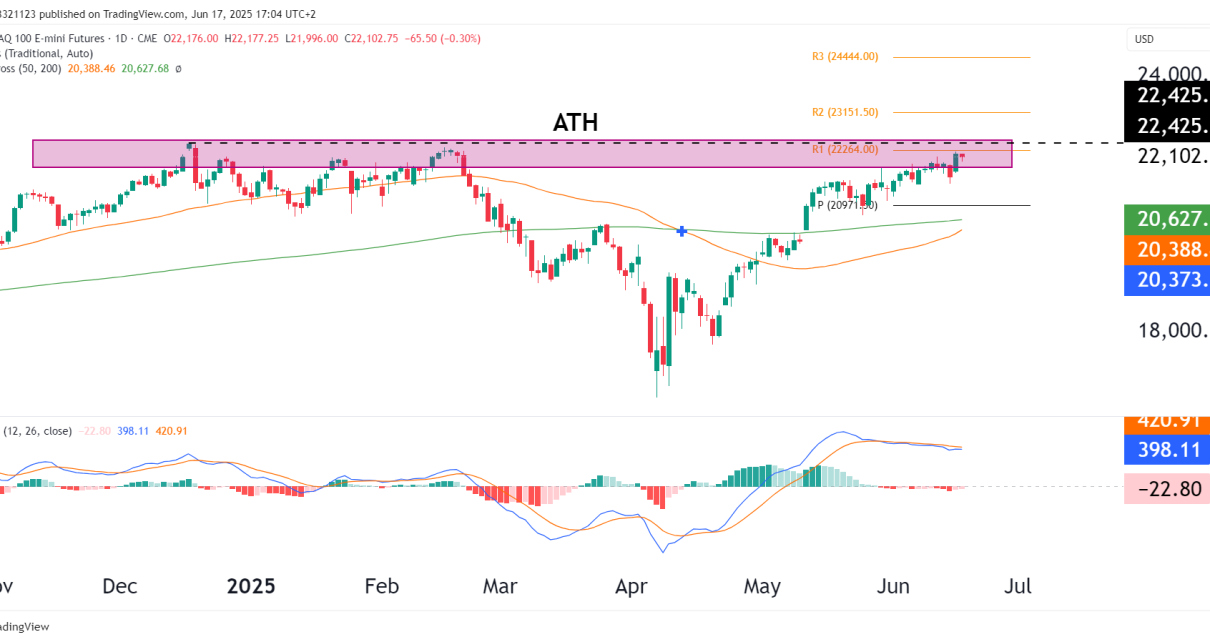
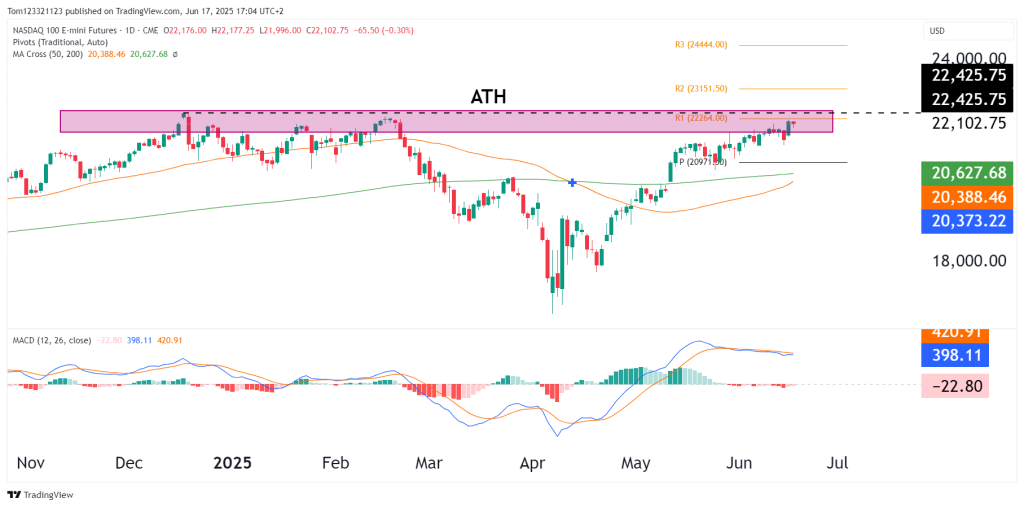
Technical Breakdown
Resistance Zone (22,264 – 22,425):
- This zone has been tested repeatedly since early 2024 but has yet to be cleanly broken.
- NQ is now consolidating just beneath resistance, which could set up for a volatility expansion breakout — or another failure.
MACD:
- Bearish divergence is forming: While price pushes higher, MACD histogram is fading and the MACD line has crossed below the signal line (–22.80).
- Momentum is waning, suggesting a bullish pause or even short-term exhaustion.
Moving Averages:
- Price is comfortably above both:
- 50-day MA: 20,388.46
- 200-day MA: 20,627.68
- The 50/200 crossover that occurred in May remains bullish confirmation of trend.
Outlook & Trade Setup:
| Term | Bias | Notes |
|---|---|---|
| Short-Term (1–2 weeks) | Cautious Bullish | Price nearing ATH, but momentum is fading. Risk of rejection. |
| Medium-Term (June–July) | Bullish | Breakout above ATH could trigger a run to 23,151 (R2) or 24,444 (R3). |
| Long-Term | Structural Uptrend | Macro trend remains bullish unless price breaks below 21,000. |
Trade Scenarios:
Breakout Play
- Trigger: Daily close above 22,425
- Target: 23,151 (R2), extension to 24,444 (R3)
- Stop: 21,850 (tight structure under breakout level)
- Rationale: Clean break from multi-month resistance zone would signal strong trend continuation.
Fade Rejection
- Trigger: Rejection candle below 22,425 + MACD crossover confirmed
- Target: 21,600–21,300 (retest zone)
- Stop: 22,500
- Rationale: Bearish divergence + resistance reaction → counter-trend move, especially if macro news softens.
Final Thoughts
NQ is at a major inflection point. Bulls are in control structurally, but without a clean breakout, the momentum divergence warns of a stall or dip. Keep a close eye on volume and intraday price action near 22,425 for clues.

