


Technical Analysis
Moving Averages:
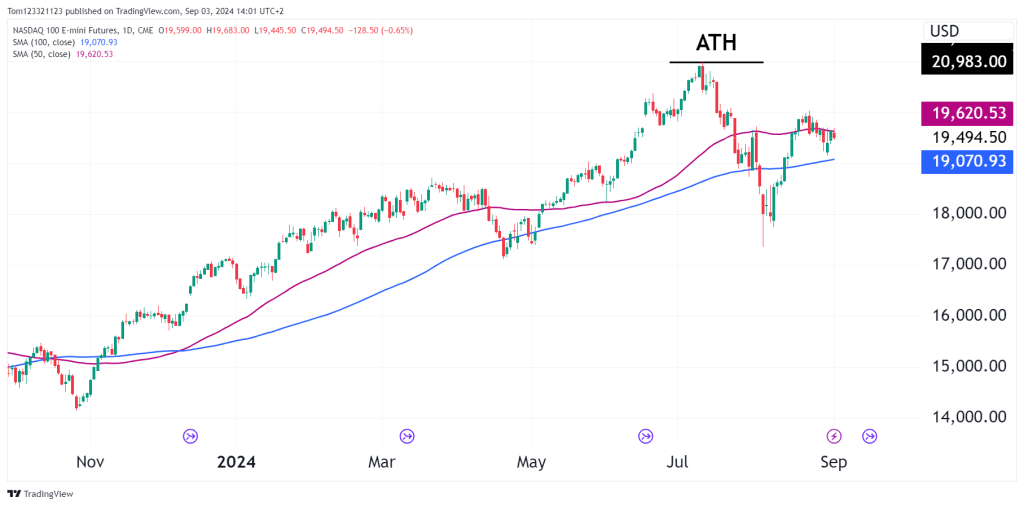
- The 50-day moving average (in purple) is currently at 19,620.53.
- The 100-day moving average (in blue) is currently at 19,070.93. The price is currently sitting between these two moving averages, showing the range-bound market with the potential for a breakout or breakdown. The 50-day moving average is acting as immediate resistance, while the 100-day moving average is providing support.
Recent Price Action: The price has recently faced resistance near the 50-day moving average as bulls tried to push prices higher and has pulled back slightly. This rejection from the 50-day moving average shows selling pressure at these levels.
Market Sentiment: The overall trend before the recent pullback in July was bullish, but the failure to reach or retest the ATH indicates a possible weakening of bullish momentum. The current consolidation between the moving averages suggests indecision.
Bearish/Short Setup:
- Entry Point: A short position could be considered if the price breaks below the 100-day moving average (19,070.93) with strong momentum. A daily close below this level would confirm the bearish sentiment and suggest that the support provided by the 100-day moving average has failed.
- Initial Target: The first target for this short trade would be the 18,000 level, which is a psychologically significant number and could provide some support.
- Extended Targets: If the price continues to fall, the next potential target could be around 17,000, which aligns with previous consolidation areas before the bullish run. Further downside could see the price testing levels around 16,000, where the market found significant support in the past.
- Stop Loss: To manage risk, a stop loss should be placed just above the 50-day moving average (19,620.53). This allows for a potential brief move above the 50-day moving average without getting stopped out prematurely.
Ending off:
Ensure that you are following strict money management rules before taking any positions in the market. The entry points above focus on bearish opportunities and ignore the possibility of a bullish trade. However, it’s important to note that the market could still surprise to the upside, especially if there is positive news or economic data that shifts sentiment quickly.
For instance, if upcoming economic reports or earnings announcements exceed expectations, this could propel the market above the 50-day moving average at 19,620.53, invalidating the bearish setup. In such a case, traders should be prepared to reassess their strategy, potentially looking for bullish opportunities instead.
Staying flexible and responsive to new information is crucial. Always ensure that your trading decisions are supported by solid risk management, including setting stop losses and adjusting positions as market conditions change. This approach will help you navigate the market effectively, whether it turns bearish or surprises to the upside.
