


Introduction
The Nasdaq 100 E-mini Futures (NQ) have broken above the previous all-time high (ATH) at 25,394.00. The index remains firmly in bullish territory, with buyers successfully defending key breakout levels as momentum continues to favor the upside. Let’s take a closer look at the technicals and what they tell us.
Technical Overview
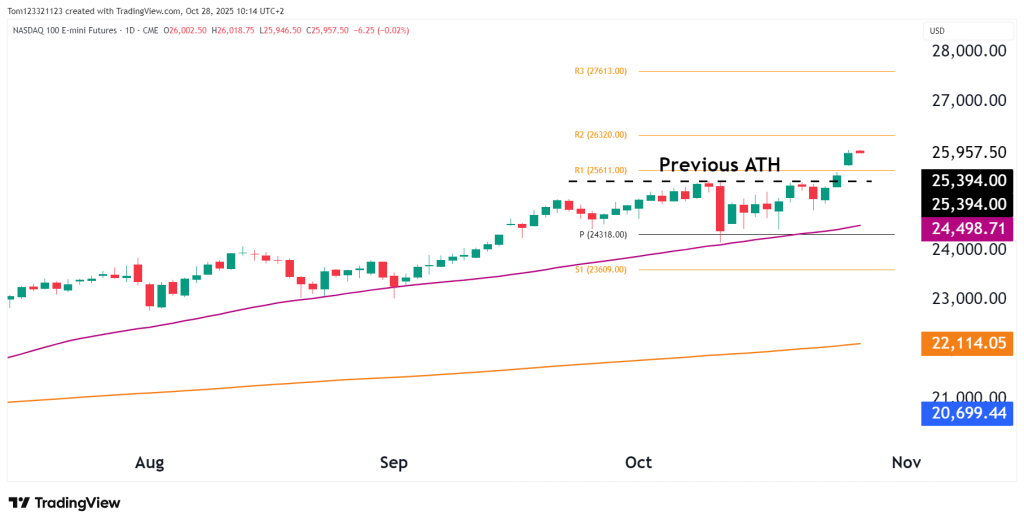
On the daily chart, NQ has decisively broken above its prior resistance at 25,394, confirming the uptrend continues. The bulls are now looking to target R2 pivot point at 26320 and possibly R3 at 27613 after that. The previous ATH could also act as support now, and it coincides with the R1 at 25611.
The 50-day moving average (24,498.71) continues to trend sharply higher, and the price keeps bouncing off it. As long as prices hold above the 25,300–25,400 zone, the breakout remains valid and the structure supportive of further upside.
The next upside targets lie near the R2 pivot at 26,320 and R3 at 27,613, both representing potential extension zones if the current breakout gains more buying power. A sustained move above 26,000 would likely accelerate bullish momentum toward these higher resistance levels.
On the downside, immediate support now lies at 25,400 (former ATH) — a crucial retest area that could determine whether the breakout holds. A daily close below this zone would expose the pivot point near 24,318 and, in a deeper retracement, the S1 support around 23,609.
Key Technical Levels
| Type | Level | Description |
|---|---|---|
| Resistance 1 | 26,000–26,320 | R2 pivot / next upside target |
| Resistance 2 | 27,613 | R3 extension / overbought projection zone |
| Support 1 | 25,394 | Previous ATH / breakout retest level |
| Support 2 | 24,318 | Pivot point / mid-channel support |
| Support 3 | 23,609 | S1 pivot / 50-day MA proximity zone |
Probability Table (Next 2–3 Weeks)
| Scenario | Estimated Probability | Notes |
|---|---|---|
| Continuation above 26,000 toward 26,300–27,000 | 55% | Breakout structure remains intact. |
| Short-term consolidation near 25,400–25,900 | 35% | Cooling after overbought RSI. |
| False breakout – pullback below 25,300 | 10% | Only likely if macro data turns risk-off or yields rise sharply. |
Fundamentals
Tech optimism is still driving the Nasdaq higher, helped by strong Q3 earnings from big tech companies. Falling Treasury yields and signs that the Fed may hold interest rates steady are also pushing investors toward growth stocks.
That said, upcoming U.S. GDP and inflation data could shake things up. If inflation comes in hotter than expected, it might raise concerns about more rate hikes, which could hurt stocks. But so far, the market still looks strong heading into November.
If the broader economic picture stays steady, the Nasdaq is in a good spot to keep climbing—especially with tech stocks holding up well and earnings staying solid.
Summary
The Nasdaq 100 E-mini Futures are holding steady just above their previous all-time high, showing a strong breakout and keeping a bullish trend. Momentum is picking up, and earnings sentiment remains positive.
As long as prices stay above 25,400, the market is likely to keep climbing, with 26,320 and 27,600 as the next targets. There could be some short-term sideways movement since the RSI is high, but the overall outlook still favors more upside.
This analysis is for educational and informational purposes only and does not constitute trading advice or a recommendation to buy or sell any futures contracts. Futures trading involves significant risk and may not be suitable for all investors. Always conduct your own research and consult with a licensed financial professional before making trading decisions.