


Introduction
The Nasdaq 100 E-mini Futures (NQ) have pulled back sharply after another failed attempt to break into new all-time highs. Following weeks of consolidation near record levels, sellers have stepped in with increased conviction, producing a strong downside move and shifting short-term momentum. The price has broken below an upward-sloping trendline that formed since the start of December.
While the broader trend remains bullish on higher timeframes, the recent price action shows the market is lacking strength.
Let’s take a closer look at the technicals and what the chart is telling us.
Market Structure & Trend
Daily chart
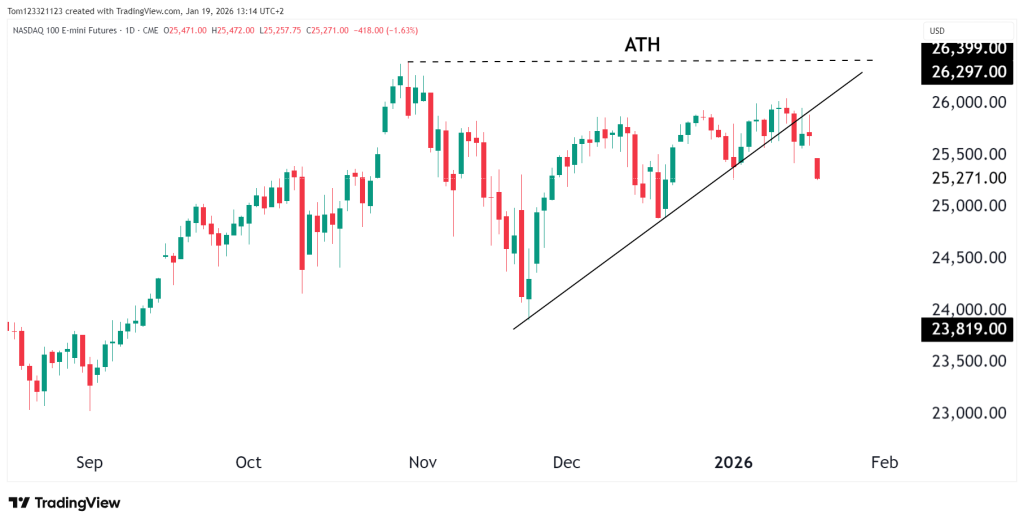
The daily chart shows a clear rejection from the all-time high resistance zone near 26,300–26,400. After failing to hold above the rising trendline that had supported price since the December lows, NQ broke down decisively, printing a large bearish candle.
Because the market tried to make higher highs but was unable on three occasions, the drop is more volatile now, and there is a gap down too after the weekend pause.
That said, price remains well above major weekly support, keeping the bullish trend intact for now.
Key Technical Levels
Resistance
- 25,850–26,000: Prior range highs and broken trendline resistance
- 26,300–26,400: All-time high resistance zone
Any recovery rallies that fail below 26,000 would likely be viewed as corrective.
Support
- 25,250–25,300: Immediate short-term support (recent lows)
- 24,800–25,000: Key daily and weekly support zone
- 23,800–24,000: Major structural support and trend-defining level
A sustained break below 24,800 would increase the probability of a deeper weekly pullback.
Looking Forward
Bullish recovery:
Price finds support in the 25,250–25,000 area and reclaims 25,850, signaling that the pullback is corrective and opening the door for another attempt toward ATHs.
Sideways consolidation:
NQ stabilizes between 25,000 and 26,000, digesting recent gains and allowing momentum to reset before the next directional move.
Deeper pullback:
Failure to hold 25,000 opens a move toward the 24,800 support zone, with risk extending to 24,000 if selling pressure accelerates.
Estimated Probability Table
| Scenario | Description | Estimated Probability |
|---|---|---|
| Sideways consolidation | Holding 25,000–26,000 range | 40% |
| Deeper pullback | Move toward 24,800 support | 35% |
| Bullish recovery | Reclaim 26,000 and higher | 25% |
Fundamentals to Watch
With Nasdaq futures (NQ) trading close to all-time highs, the market has become more reactive to new information. Small changes in macro data are having a bigger impact than usual. Moves in Treasury yields, incoming inflation reports, and comments from the Federal Reserve are all closely watched, especially because higher rates tend to pressure growth and technology stocks that make up much of the Nasdaq.
Earnings are likely to be the next major source of volatility. Results from large Nasdaq companies will help determine whether the recent pullback continues or finds support. Weak earnings or cautious forward guidance could add to selling pressure, while solid results and strong outlooks may help steady prices and open the door for another move higher.
This analysis is for educational and informational purposes only and does not constitute trading advice or a recommendation to buy or sell any futures contracts. Futures trading involves significant risk and may not be suitable for all investors. Always conduct your own research and consult with a licensed financial professional before making trading decisions.