


Introduction
Nasdaq 100 futures have been consolidating between 24,000 and 26,000 since October after seeing an 18% rally this year. The 50 moving average, which has held as strong support, is still doing its job, but not as well as a few months ago, showing that the buying power is lower and profit-taking is dominating. At this time of year it is normal to see this as funds and investors flatten or rebalance their portfolios. In today’s technical analysis, we will look at the daily and the weekly charts and see what they are telling us.
Technical Analysis
Daily Chart
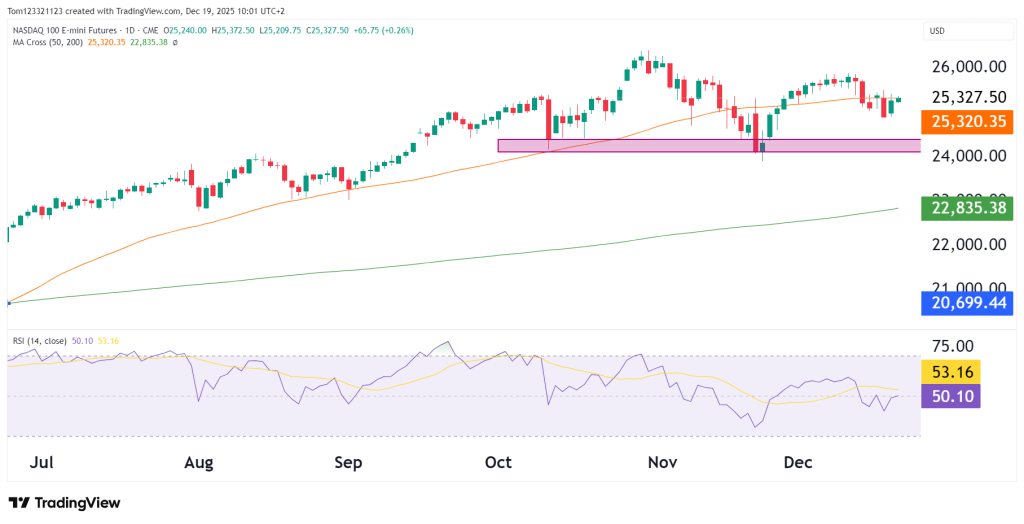
On the daily timeframe, NQ is holding above the 50-day moving average near 25,320. The highlighted support zone around 24,900–25,050 has already been tested and defended, reinforcing it as an important short-term floor. Momentum, as measured by RSI, has reset back toward neutral around the 50 level, easing prior overbought conditions and allowing room for the next move.
Immediate resistance sits near the recent swing highs around 25,800–26,000. A sustained move above this zone would signal renewed bullish momentum and open the door to further upside. Failure to hold above the 50-day moving average, however, would increase the risk of a deeper pullback toward the 24,500 region.
🎯 Ready To Get Funded?
Start your 7-day free $100K evaluation with OneUp Trader and take the first step toward becoming a funded trader.
Start Evaluation Now →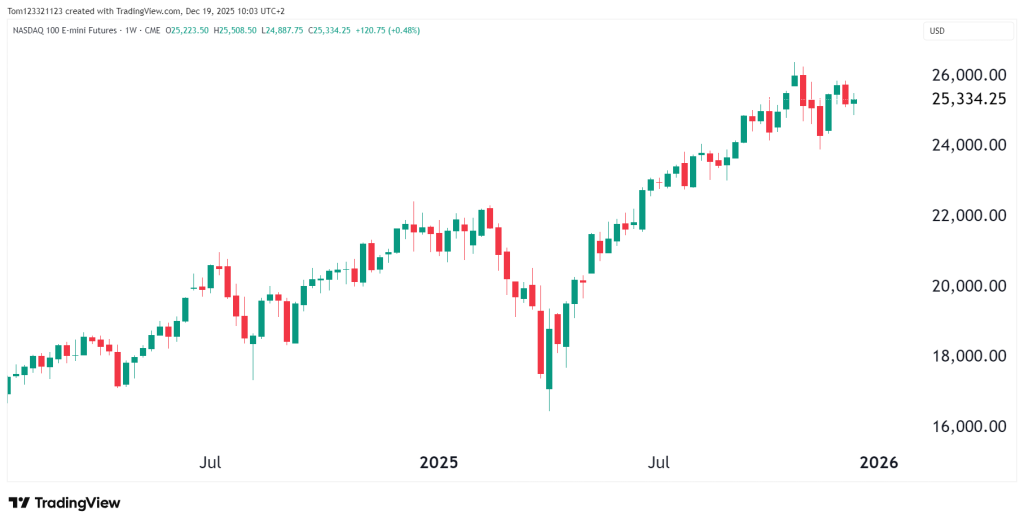
Weekly Chart
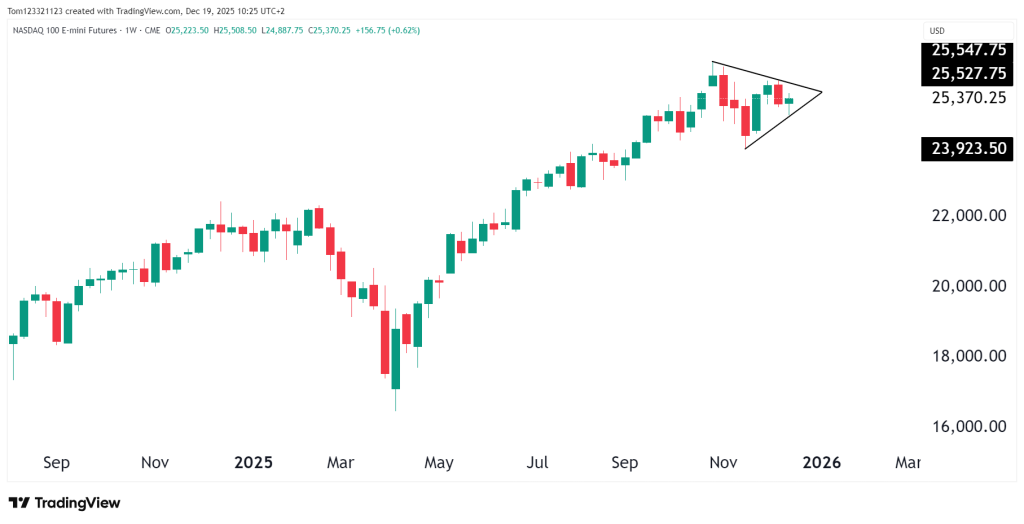
The weekly chart shows just how strong the rally has been this year, with pullbacks lasting no longer than just one week. The main level to watch on this chart is around 24,000, which needs to hold to maintain the bullish momentum. There could be a small formation of a pennant now, so a break above 26,000 could likely lead to a move above the all-time highs.
Key Technical Levels
| Type | Level | Description |
|---|---|---|
| Resistance 1 | 25,800–26,000 | Recent highs. |
| Resistance 2 | 26,500+ | Measured move. |
| Support 1 | 25,300–25,200 | 50-day MA / short-term support |
| Support 2 | 24,900–25,050 | Key demand zone |
| Support 3 | 24,500 | Deeper corrective support |
Estimated Probability Table (Next 2–3 Weeks)
| Scenario | Estimated Probability | Notes |
|---|---|---|
| Break higher toward 25,800–26,000 | 50% | Trend remains intact with consolidation near support. |
| Range-bound consolidation | 35% | Momentum reset suggests sideways action before next move. |
| Breakdown toward 24,500 | 15% | Would require drop below 50 MA. |
Summary
In short, Nasdaq 100 futures remain in a strong uptrend, but momentum has slowed as the market digests this year’s gains. Key support levels are still holding, which keeps the bullish outlook intact for now. A break above 26,000 would suggest the next leg higher, while a drop below support could lead to a deeper pullback. Overall, the trend is positive, but patience is needed as the market consolidates.
This analysis is for educational and informational purposes only and does not constitute trading advice or a recommendation to buy or sell any futures contracts. Futures trading involves significant risk and may not be suitable for all investors. Always conduct your own research and consult with a licensed financial professional before making trading decisions.

