NQ Drops 2.8% in a day
NQ drops 2.8% in a day, and everyone gets scared. The markets have been going up and only up, so a pullback is due at some point. If you look at the NQ chart you will see nothing but green candles all the way and an RSI that has been overbought since the beginning of june on the daily chart. There are some news events that took place this week, however, that caused the temporary drop in US equities.
Inflation
The Federal Reserve’s next policy meeting is scheduled for July 30-31, 2024. Analysts expect the Fed to maintain its current interest rates, given the recent strong economic data. The Fed has held the federal funds rate at 5.25-5.50% since July 2023, following aggressive rate-hiking aimed at controlling inflation, which had peaked at over 9%.
On Thursday we saw the consumer price index drop by 0.1% in June. This was cooler than expected and has reinforced bets for a cut in September.
Technical Analysis
Bollinger Bands
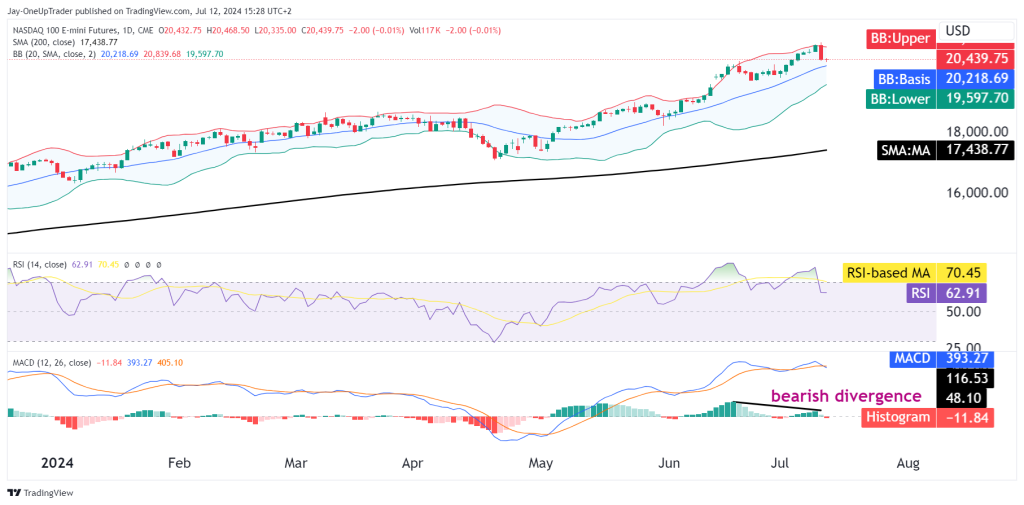
- The price is near the upper Bollinger Band ($20,435.00), which means the market looks like it could be overextended int he short term.
- The bands are widening, indicating increased volatility so we might see a strong move come soon.
RSI (Relative Strength Index):
- The RSI has been overbought since the beginning of June. At the moment, it is in the neutral zone, but it looks like there is still a downside on the RSI before long can be taken safely.
MACD (Moving Average Convergence Divergence):
- The MACD histogram shows a bearish divergence (-12.14). It is something to be wary of but doesn’t mean to say we should take shorts but rather, wait for some time before taking a long instead of buying up at these levels.
Technical Patterns
Bearish Divergence:
- The MACD histogram is showing a bearish divergence while the price is making higher highs. This can be an early signal of a potential trend reversal or a pullback.
Trade Opportunities
Short Position
Given the bearish divergence in the MACD and the price nearing the upper Bollinger Band, a high-probability short trade setup could be considered.
- Entry: Consider entering a short position if the price fails to break above the current high and shows signs of reversal. A confirmation would be a bearish candlestick pattern, such as a shooting star or bearish engulfing.
- Target: The initial target for the short position could be the middle Bollinger Band ($20,218.45), followed by the lower Bollinger Band ($19,597.80) if the bearish momentum continues.
- Stop-Loss: Place a stop-loss above the recent high at around $20,470 to manage risk.
Conclusion
If you are bullish but do not have a position in the market, it could be better to wait it out, at least for the RSI to pull back to the 50 line or see how the price reacts off the Bollinger 50. If a strong bullish reversal candle appears it is a possible long entry.