


Weekly Chart
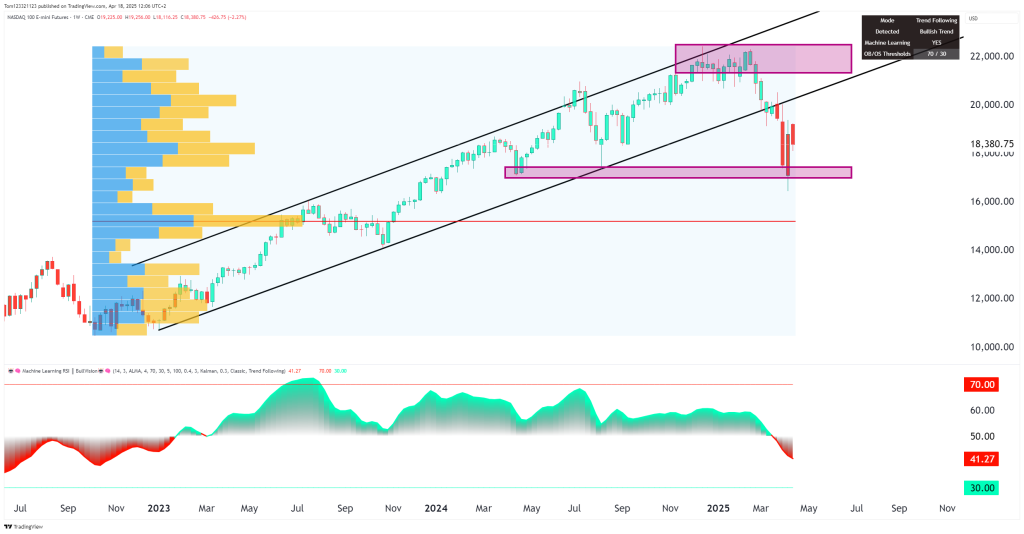
- Current Price: 18,380.75
- After plunging ~26% from the highs, NQ found key support at 17,000–17,300, an important historical demand zone.
- Volume Profile: Highest historical volume traded between 15,500 and 17,500 — strong institutional support likely in this range.
- RSI: Currently confirming a bearish trend on the weekly chart but not oversold.
- Market sentiment remains structurally bullish in the longer-term trend following model, but heavily damaged in the medium-term.
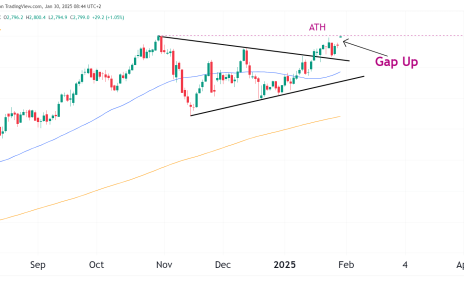
Daily Chart

- After the selloff, price bounced from the 17,300–17,500 demand zone and is now retracing toward 19,000–19,500.
- 50-day and 200-day SMAs (20,137.88 and 20,370.31 respectively) are acting as major resistance overhead.
- Pivot Points:
- Immediate resistance: ~18,870–19,000
- Higher resistance: ~20,000 (SMA cluster + broken support)
- Support: 17,700–17,300 zone remains key.
Technical Key Points
| Indicator/Zone | Status | Situation |
|---|---|---|
| Rising Channel | Bearish Break | Bulls still have a chance to reclaim it |
| Weekly RSI | Oversold and rebounding | Classic setup for a relief rally |
| Daily SMAs | Bearish cross (death cross) | Headwind on rallies |
| Volume Profile | Heavy support under 17,500 | High-probability defense zone |
Bullish Scenario
- If price sustains above 18,700–19,000, then rally to test 20,000–20,300 is possible.
- Strong reclaim of 20,300 (50/200 SMA zone) would suggest a new medium-term bottom is in.
- Short Squeeze Potential: Bears may rush to cover if 19,000+ is recaptured.
Upside Targets:
- 19,000 (near resistance)
- 20,300 (critical decision zone)
Bearish Scenario
- Failure to reclaim 19,000 and rejection below the daily SMAs could cause a lower high formation.
- Potential resumption of selling pressure back to retest 17,700–17,300 support.
- If broken, a collapse toward 16,400–16,600 zone becomes increasingly probable.
Downside Targets:
- 17,700 (first line of defense)
- 17,000–16,600 (major floor)
Current Market Stance
This bounce off support still looks like a relief rally rather than a confirmed trend reversal — at least for now.
- Macro backdrop: Sticky inflation, aggressive Fed rhetoric, and global growth concerns still weigh on risk appetite.
- Technical structure: Below major moving averages and inside a deep correction phase.
- Sentiment: Very fragile — rallies could be sharp but short-lived unless macro improves.
Conclusion:
Short-term: Positive momentum building (toward 19,000)
Medium-term: Highly cautious unless 20,300+ is regained
Long-term: Still in structural bull trend but severely damaged