


Introduction
The long-term NQ trend continues to the upside along with the other US index markets. The price has been consolidating, however, since hitting an ATH of 26,399 in November, and a symmetrical triangle is now forming. Traders and investors are watching U.S. inflation data, labor market reports, and the FOMC, and any bullish developments in any of these will likely result in a push above the ATH. Let’s take a closer look at the technicals and what they are telling us.
Technical Analysis
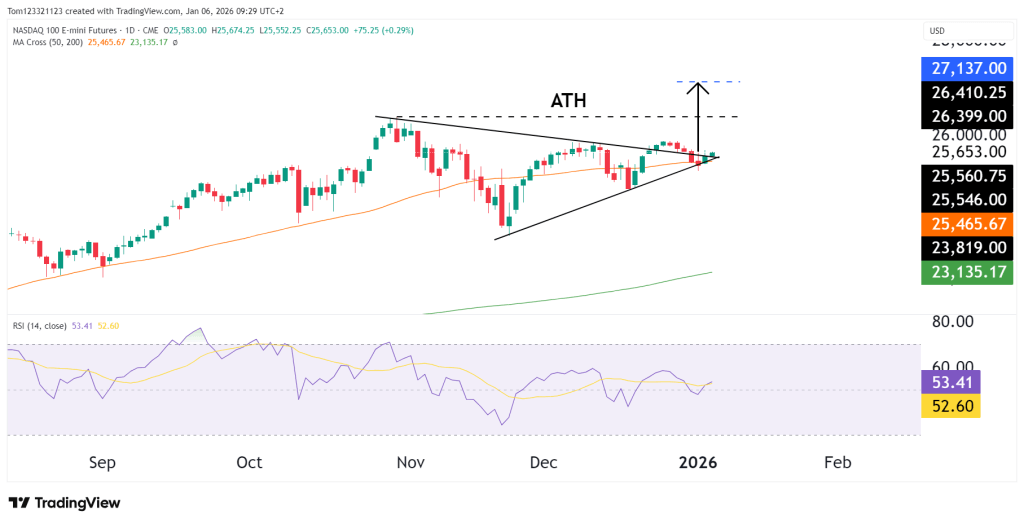
The broader trend remains bullish, with NQ holding well above both the 50-day and 200-day moving averages. Recent price action has formed a symmetrical triangle pattern as mentioned in the introduction. Now, if the price breaks above it, the next two targets would be the ATH and then $27,137.
The 50 moving average is also well above the 200; there is a big divergence between the two, showing how strong the uptrend has been. A move down to the 200 MA would be a shock for the market and is probably only likely right now from a major catalyst or black swan event.
Technical Levels
Resistance
- 26,350–26,400: All-time high resistance zone.
- A sustained break and acceptance above this area would confirm trend continuation and open the door to price discovery.
Support
- 25,550–25,600: Short-term support.
- 25,450–25,500: 50-day moving average and key support.
- 23,800–24,000: Major demand zone and broader trend support.
Momentum (RSI)
RSI is hovering just above 50, reflecting neutral-to-bullish momentum. This aligns with the current consolidation phase and suggests momentum is resetting rather than weakening meaningfully.
A push back toward the 60–65 zone would likely accompany an upside breakout.
Possible Technical Scenarios Ahead
- Bullish breakout:
A decisive move above the ATH region would likely trigger upside continuation following the consolidation. - Range continuation:
Price may remain compressed between 25,550 and 26,400 as the market waits for a catalyst. - Deeper pullback:
A loss of 25,500 could lead to a rotation toward the 50-day MA or the lower demand zone, without invalidating the broader uptrend.
Estimated Probability Scenarios
| Scenario | Description | Estimated Probability |
|---|---|---|
| Bullish continuation | Break and hold above ATH | 45% |
| Range consolidation | Continued compression | 40% |
| Deeper pullback | Move toward 25,000–24,800 | 15% |
Fundamentals
NQ is still being supported by big tech stocks, strong interest in AI, and hopes that the Fed will start easing policy later in 2026. Traders are watching inflation reports, comments from the Fed, and earnings from major tech companies to make sure the outlook stays positive.
If financial conditions tighten or earnings disappoint, markets could get more volatile. But if inflation comes in softer, it could support continued risk-taking.
This analysis is for educational and informational purposes only and does not constitute trading advice or a recommendation to buy or sell any futures contracts. Futures trading involves significant risk and may not be suitable for all investors. Always conduct your own research and consult with a licensed financial professional before making trading decisions.
