The bearish target below $11,000 has been reached. Using Fibonacci Retracements to set potential bearish targets. Analyzing the yearly NQ chart alongside quantitative easing. 3 indicators to pay close attention to. Bearish Break Of Consolidation Zone We have been monitoring the consolidation zone on NQ now since the middle of November. Price remained in a Read More…
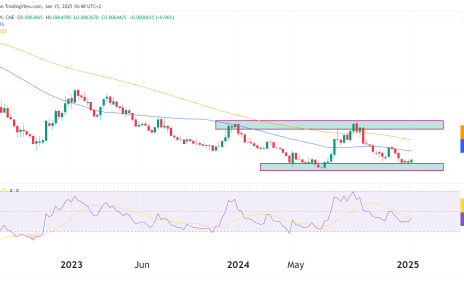
Introduction The Japanese Yen futures (6J) remain in a prolonged downtrend, as weakness continues amid a strengthening U.S. dollar. The yen is currently trading near the lower boundary of a support zone, as the dollar continues to rally on optimism surrounding President Trump’s economic policies. Let’s analyze the technical and fundamentals of the yen futures Read More…
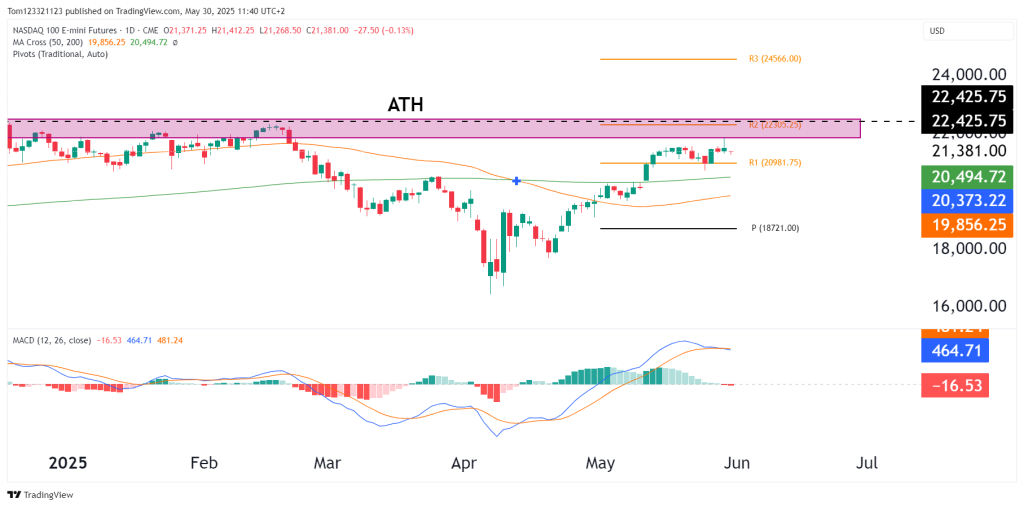
Introduction The S&P 500 e-mini futures (ES) have painted two bearish candles for the past two weeks trade. This was overdue as ES and other US equity markets have soared for 2024. The pullback we expect is likely to be a short-term outlook and by no means a trend reversal, so keep that in mind Read More…