

Introduction
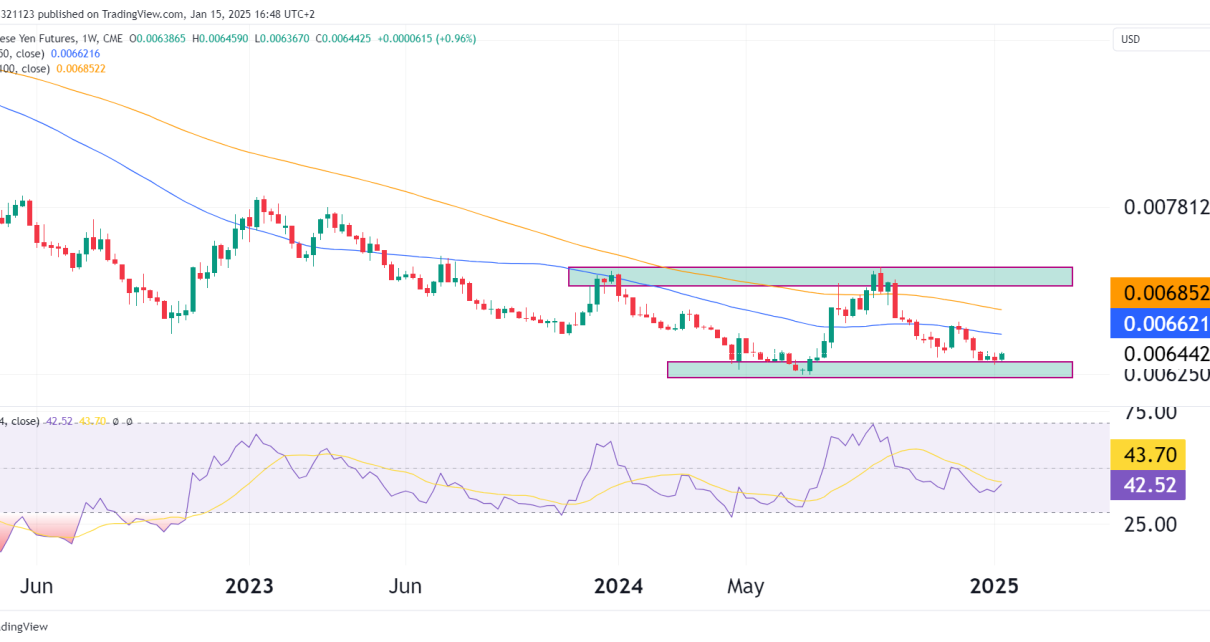
The Japanese Yen futures (6J) remain in a prolonged downtrend, as weakness continues amid a strengthening U.S. dollar. The yen is currently trading near the lower boundary of a support zone, as the dollar continues to rally on optimism surrounding President Trump’s economic policies. Let’s analyze the technical and fundamentals of the yen futures market.
Fundamental Overview
Dollar Strength Driving Yen Weakness:
- The U.S. dollar’s ongoing rally, fueled by market optimism over President Trump’s pro-growth agenda, continues to put downward pressure on the yen. Expectations of fiscal stimulus, tax cuts, and infrastructure spending have lifted U.S. Treasury yields, drawing capital flows toward dollar-denominated assets.
- The Bank of Japan (BoJ), maintaining its ultra-loose monetary policy stance, has further exacerbated the yen’s struggles. With U.S.-Japan interest rate differentials widening, the yen remains an unattractive asset compared to the dollar.
Economic Divergence:
- While the U.S. economy exhibits resilience, Japan faces challenges with slow economic growth, weak inflation, and ongoing structural issues. This divergence is reflected in the persistent yen weakness against the dollar.
Global Risk Sentiment:
- Although the yen is traditionally seen as a safe-haven asset, the current risk-on environment driven by U.S. optimism has reduced its appeal. Investors have shown a preference for the dollar as the go-to safe-haven currency.
Technical Analysis Overview
Key Support Zone:
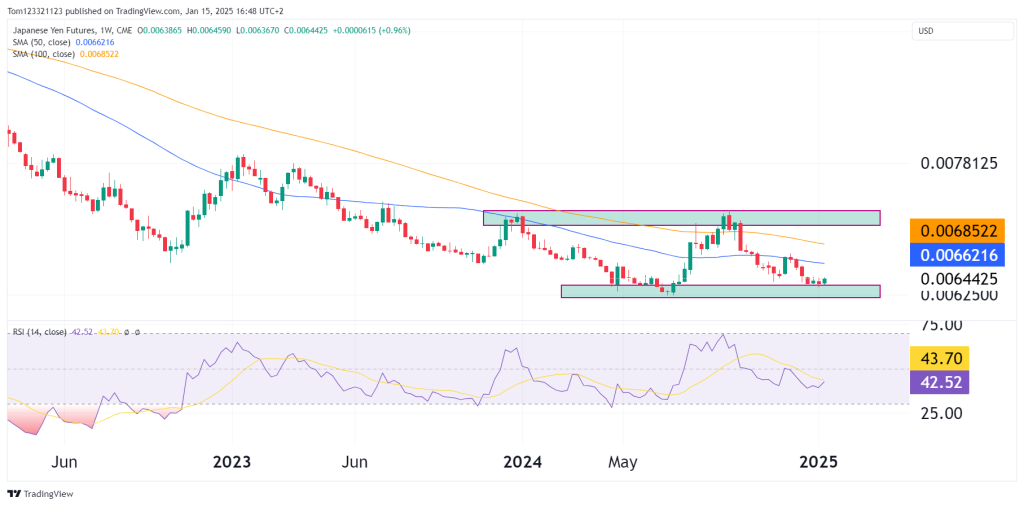
- The price is trading within a critical support zone between 0.006250 – 0.006442, which has historically acted as a floor during periods of extended selling. This zone was last tested in mid-2023 and successfully led to a relief rally.
Resistance Zone:
- The key resistance lies in the 0.006621 – 0.006852 zone, which has capped multiple attempts to recover since mid-2024. The 100-week SMA (0.006852) aligns with the upper boundary, strengthening this resistance area.
Indicators Analysis
Relative Strength Index (RSI):
- The RSI is at 42.52. While it is not yet in oversold territory, the lack of upward momentum suggests that sellers remain in control.
- A move below 40 on the RSI would further confirm a continuation of the bearish trend.
Moving Averages:
- The 50-week SMA (0.006621) and 100-week SMA (0.006852) are sloping downward, signaling persistent bearish momentum in the medium and long term.
- The price trading below these moving averages reinforces the strength of the downtrend.
Scenarios to Watch
Bullish Case:
- If the support zone between 0.006250 – 0.006442 holds, the yen could see a relief rally toward the 50-week SMA (0.006621).
- A breakout above the 0.006852 resistance zone and the 100-week SMA would indicate a potential reversal of the long-term trend, though this scenario is unlikely without a significant catalyst, such as a dollar pullback or BoJ policy change.
Bearish Case:
- A decisive breakdown below 0.006250 would signal the continuation of the bearish trend, opening the door for further declines.
- Key downside targets include 0.006100, a psychological level, and potentially lower, depending on the strength of dollar momentum.
Trade Ideas
Bearish Setup:
- Entry: Short positions on a confirmed breakdown below 0.006250, targeting a move toward 0.006100.
- Stop-Loss: Above 0.006442 to manage risk.
Bullish Setup:
- Entry: Long positions near 0.006250, provided the support zone holds and there are signs of a reversal.
- Targets:
- First target: 0.006442.
- Second target: 0.006621 (50-week SMA).
- Stop-Loss: Below 0.006200 to limit downside exposure.