

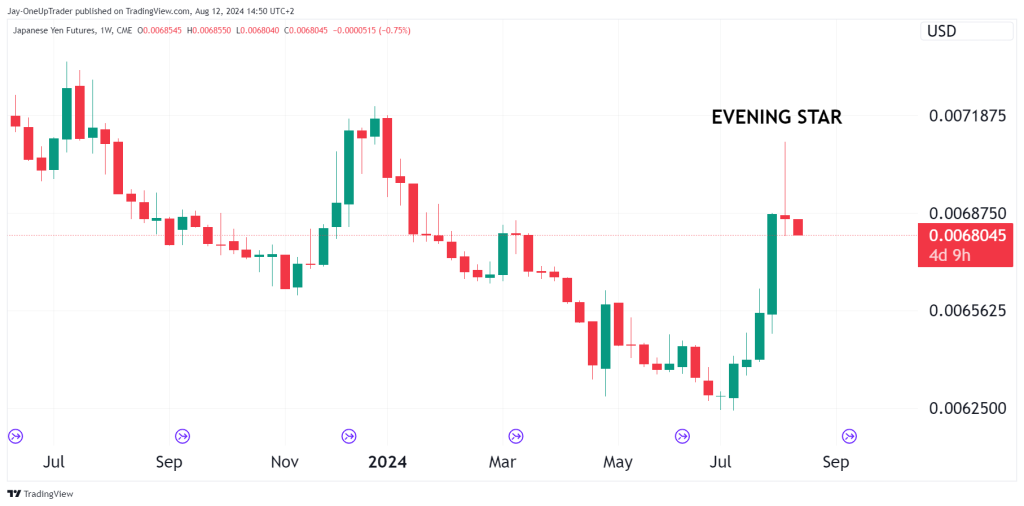
Weekly Chart
There is an evening star pattern on the weekly chart which hasn’t closed yet. J6 bears are hoping this weeks trading will close red because it will likely lead to a big sell off in the Yen most likely back to previous support levels which is a 9% drop from here.
The weekly chart is a time frame that most day traders avoid but can be very useful in identifying the long-term trend. Even if trading on a short time frame like the 15-minute chart, it can be useful to look at the bigger picture on the larger time frames to help in gauging overall sentiment.
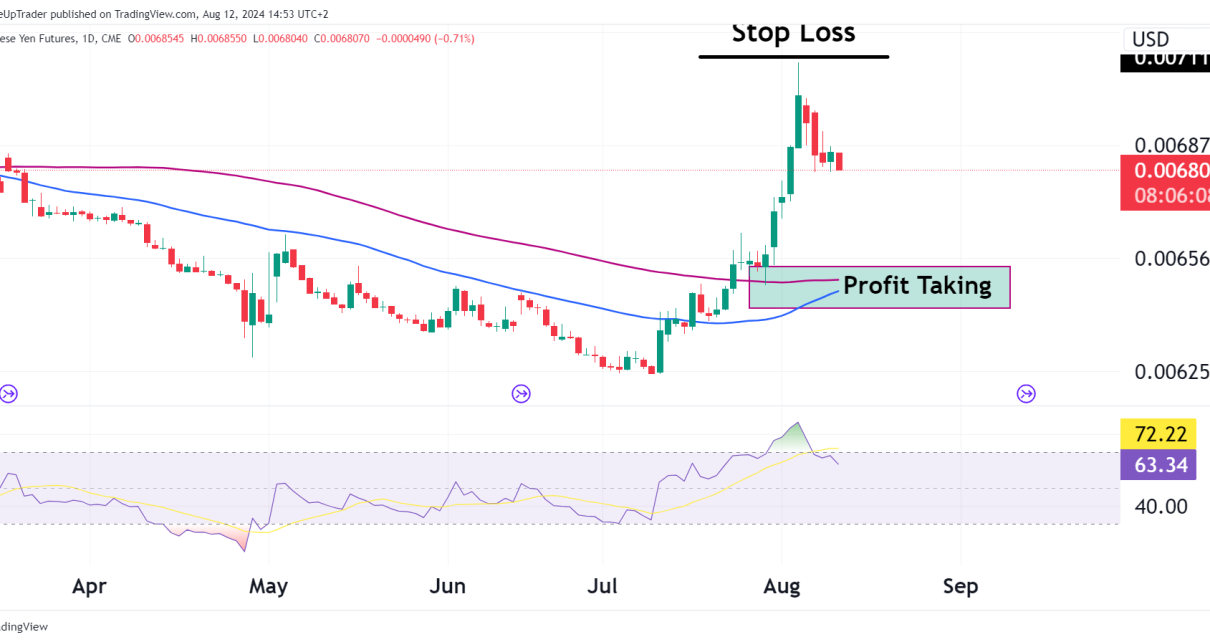
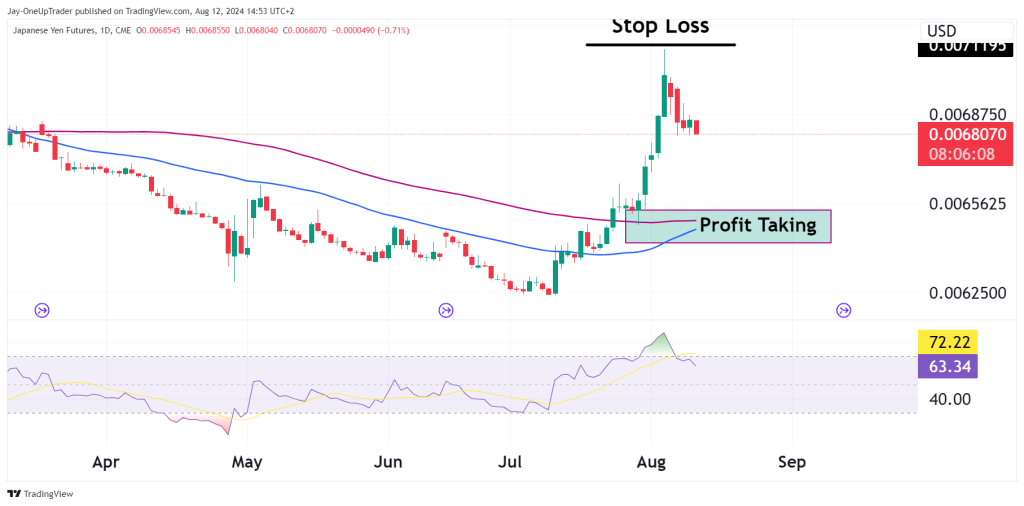
Daily Chart
Grinding down to the daily chart, the technical indicator that sticks out the most is the RSI that was overbought. Also, the 50 SMA has steadily been below the 100 SMA since March 2021, with one a few times when the market consolidated. Did we see the 50 moves above the 100.
From here, bears are looking for prices to drop back down to the 50 and 100 sma zones for profit-taking.
If you have any technical analysis or a great trade you took with an explanation of your process, please send it to us via our Instagram here or email [email protected] or [email protected]. The trader who sends the best analysis/trade that week will receive a 25% discount code to use on any Evaluation.