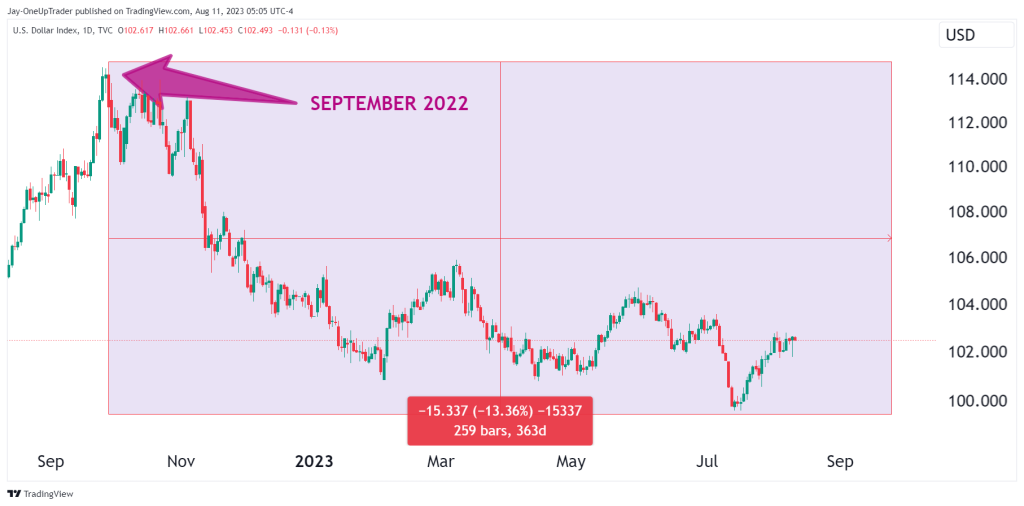
- DXY is down 13% since the top was made in September of 2022.
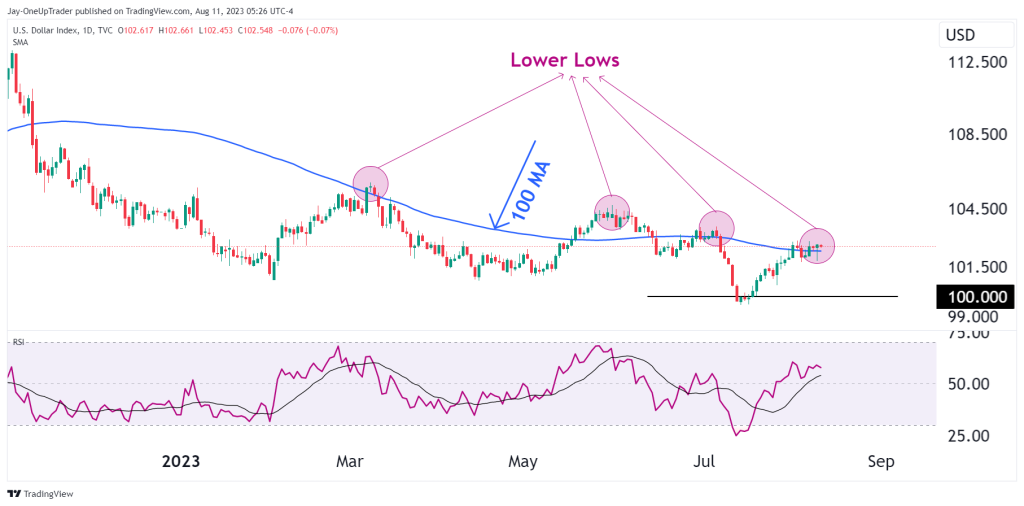
- RSI, 100 MA, and price action give some mixed signals, but the chart is bearish overall
Introduction
As the Dollar continues to be at the forefront of the news due to Fed policy, is it time for it to drop once more? DXY has lost 13% of its value since the high was made back in September of last year (See chart below). Keeping this purely technical, let’s look at a few key factors that may drive the price of the Dollar in the next few days and weeks.
Technical analysis
RSI: The RSI plunged deeply into oversold territory, printing 24 on the indicator before the market was bid back up to give the RSI a new reading of 60. Looking at the indicator, it would be a surprise if it made another low below 24. Price could still fall below the market low and psychological level of 100 with the RSI giving us bullish divergence.
100 MA: The market appears to be respecting the 100 MA as resistance as time goes on but if we look at the MA on its own, there is a sign of it flattening as the market consolidates sideways. As it happens with all currencies, technicals can only get us so far because they are so driven by fundamentals. The technicals, however, can give us an idea of what the market sentiment is. When it comes to the 100 MA, it tells us that the market ‘wants’ to move sideways for some time to begin an accumulation phase.
Price action: In general, price action is still bearish overall. There are still clearly lower lows on the daily chart and this is something we must keep in mind.
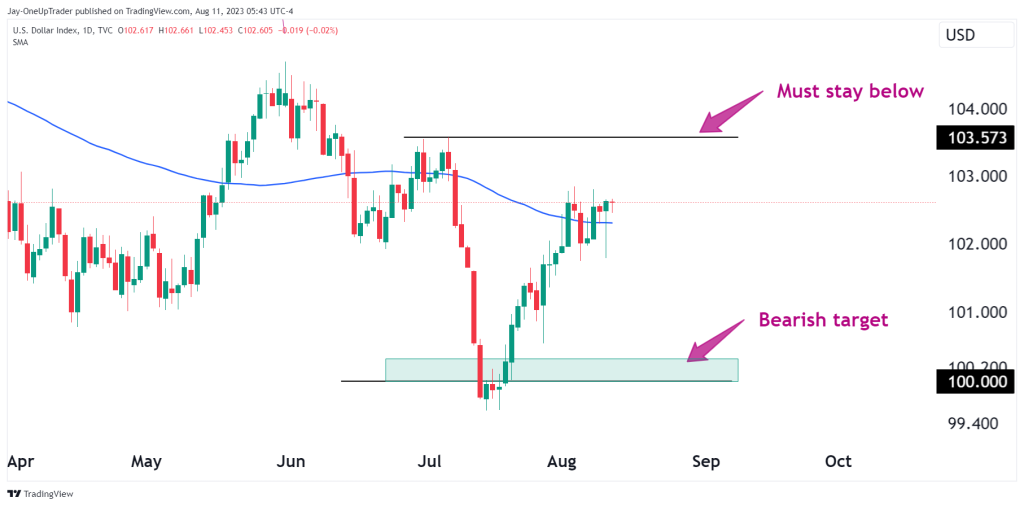
Zooming In
If DXY remains below 103.5 then the chart remains bearish overall. A target of the psychological level of $100 is in play for the bears as DXY could roll over and drop once more in the coming days and weeks.