


Overview
Gold futures (COMEX: GC) continue to trade near record highs with massive long-term momentum and short-term consolidation. Price could be coiling up for another bullish breakout. With macroeconomic uncertainty, a weakening U.S. dollar, central bank demand, and inflation hedging flows underpinning sentiment, gold remains the strongest major asset class of 2025.
Monthly Chart
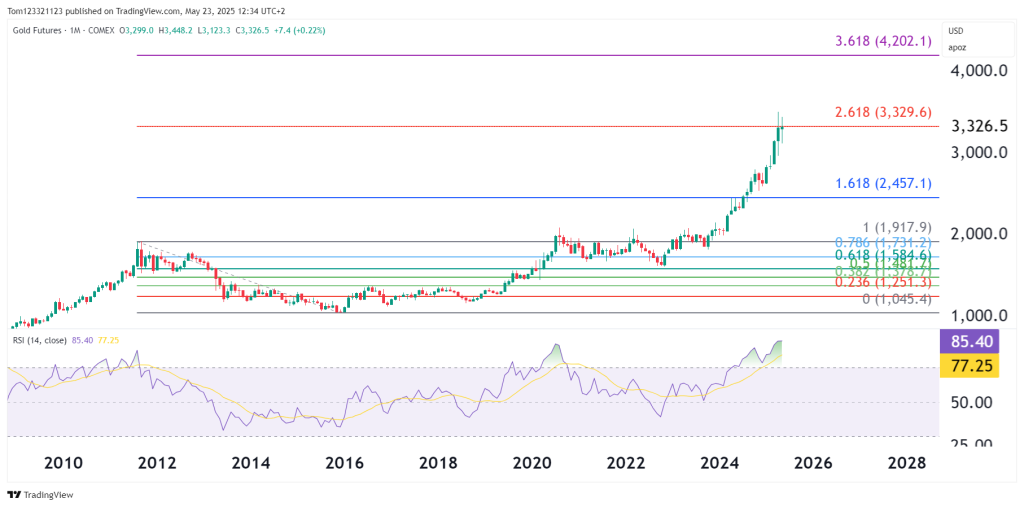
RSI (Monthly): 85.40 – Extremely overbought but historically sustainable at extremes in gold supercycles
Key Fibonacci Extensions (from 2011–2015 correction):
- 1.618 at $2,457.10 — cleared with conviction
- 2.618 at $3,329.60 — currently being tested
- 3.618 at $4,202.10 — long-term breakout target
Highlights
- Parabolic trend intact since breakout above the $2,075 ceiling.
- If the 2.618 level is converted into support, a wave extension structure from the 2015 base and Fibonacci projections point to $3,800–$4,200, which is technically achievable.
- Volume and macro narrative continue to align with institutional accumulation phase.
Daily Chart Insights
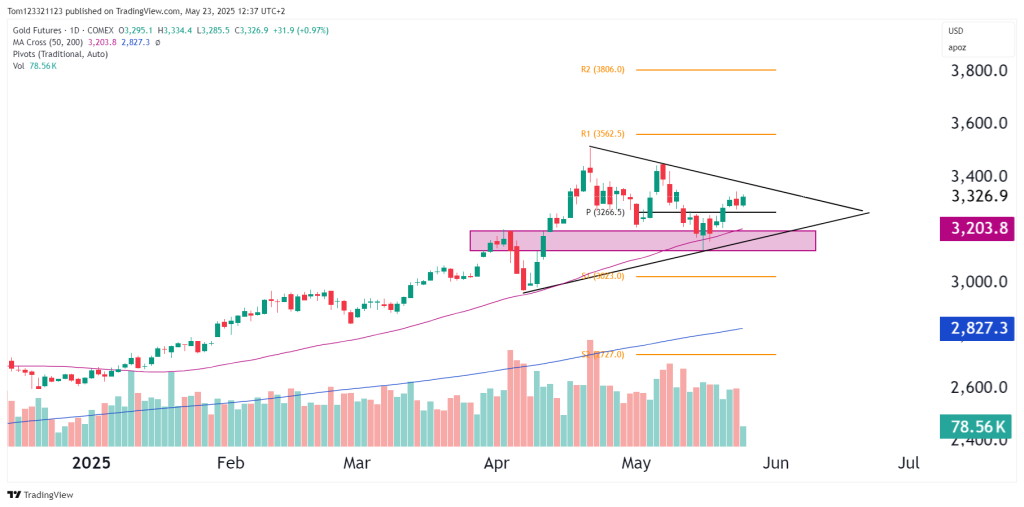
Support & Resistance Levels
- Pivot (P): $3,266.50
- Support: $3,203.80 (50-day MA & structure support)
- Resistance: $3,562.50 (R1) → $3,806.00 (R2)
Technical Setup
- Symmetrical Triangle / Coil Pattern forming.
- Price has stabilized after testing and bouncing from the 50-day MA near $3,200, forming a tight range of higher lows, pointing toward bullish continuation.
- Volume profile shows decreasing volume into the coil — classic consolidation behavior before expansion.
Indicators:
- RSI (Daily): 63, cooling off from overbought but still in bullish territory
- Volume (78.56K): Pullback days lighter than up days, confirming accumulation
- 50-day and 200-day MAs are firmly upward sloping, confirming uptrend strength
Bull Case
- Monthly breakout + daily consolidation is a textbook bullish continuation pattern.
- If $3,330–$3,350 is cleared with volume, target range of $3,560 to $3,800 opens up quickly.
- Central bank gold purchases are at historic highs (China, Russia, emerging markets).
- Fed pause or pivot and declining real rates provide tailwinds.
Trigger: A daily close above $3,350 with volume → confirmation of triangle breakout.
Bear Case
- RSI on the monthly is very high (85.40), risk of pullback/consolidation.
- Triangle breakdown below $3,200 opens room for retest of $3,000–$2,830 (S1 / 200-day MA).
- A sudden rise in yields or USD strength could pressure prices.
Outlook & Probabilities
| Timeframe | Bias | Notes |
|---|---|---|
| Short-term | Neutral-Bullish | Watching triangle breakout above $3,350 or breakdown below $3,200 |
| Medium-term | Bullish | Structure supports another leg up toward $3,560–$3,800 |
| Long-term | Strongly Bullish | Multi-decade breakout + wave extension targeting $4,200+ |
Final Thoughts
Gold’s monthly breakout is historic, and the daily triangle is the pause before a probable next leg. Unless $3,200 fails decisively, the dominant theme is accumulation.
If momentum accelerates, a parabolic spike to $3,800+ could occur faster than expected. On the other hand, any break below $3,200 would warrant caution.