


Introduction
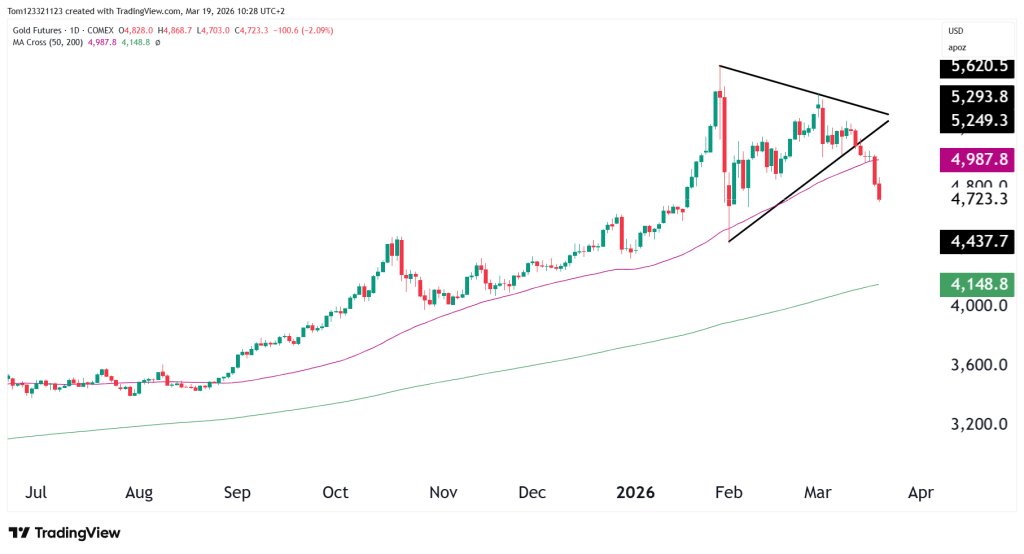
Gold has now clearly broken down from the symmetrical triangle that we discussed in the previous analysis. The important $5,000 level has failed, and the price is dropping fast.
What was a balanced consolidation is no longer neutral. The market has chosen direction, and for now that direction is to the downside. The focus now is no longer on whether a breakout will occur, but on how this move develops and where buyers may step back in.
What Changed Since Yesterday
Yesterday, the key level to watch was $5,000. That level acted as both horizontal support and the lower boundary of the triangle.
Price has now moved below it with conviction. In the process, gold also lost the 50-day moving average near $4,987, which adds to the technical weakness. The move lower has been relatively clean, with little buying response so far. That tells us this is not just a temporary dip but a proper shift in momentum.
Market Structure & Trend
On the daily chart, the structure has transitioned from consolidation into a corrective phase. The series of higher lows has been broken, and price is now starting to print lower highs and lower lows.
This matters because the triangle was forming after a strong uptrend. When a continuation pattern like that fails to break higher and instead breaks down, it often leads to a deeper pullback than traders initially expect.
The broader trend is still bullish on a higher timeframe, but in the short term, control has shifted to sellers. The important level to watch is the downwick that formed back in Feb where buyers should step in again.
Macro Context
The move also makes sense when viewed alongside other markets. The U.S. dollar has been strengthening, and that tends to weigh on gold. At the same time, some of the urgency around safe-haven demand has eased slightly, even though geopolitical risks are still present.
Key Technical Levels
The most important level now is $5,000, but its role has changed. It is no longer support. It is now resistance. Any move back into that area will likely be tested by sellers first.
Below current price, the next area to watch is around $4,700, where the market is currently trying to stabilize. If that level does not hold, the next major level sits near $4,437, which is the February low and a strong structural support zone.
Scenarios Going Forward
The most straightforward scenario is continuation lower. As long as gold remains below $5,000, the market is likely to work its way toward deeper support, with $4,437 being the next major target.
There is also room for a short-term bounce. Markets rarely move in a straight line, and a move back toward $4,900–$5,000 would not be surprising. However, unless price reclaims and holds above $5,000, that type of move would likely be corrective rather than a true reversal.
For the bullish case to regain control, gold would need to move back above $5,000 and re-enter the prior range. At this stage, that is possible but not the most likely outcome.
Probability Table
| Scenario | Description | Estimated Probability |
|---|---|---|
| Bearish Continuation | Price remains below $5,000 and moves toward $4,437 support. | 50% |
| Relief Bounce | Short-term bounce toward $4,900–$5,000 before another move lower. | 30% |
| Bullish Reversal | Price reclaims $5,000 and rebuilds upward momentum. | 20% |
This analysis is for educational and informational purposes only and does not constitute trading advice or a recommendation to buy or sell any futures contracts. Futures trading involves significant risk and may not be suitable for all investors. Always conduct your own research and consult with a licensed financial professional before making trading decisions.

