


Introduction
Gold futures have started to find a floor since our previous analysis, and bulls are trying to push prices higher once more. The RSI has stabilized around the 50 level, and the candlesticks are also smaller, indicating less volatility and a possible shift in trend. Gold is up 50% for the year, and the recent pullback of 11% was the first real retracement we have seen since 2023.
🎯 Ready to Prove Your Skills?
Start your 7-day free $100K evaluation with OneUp Trader and take the first step toward becoming a funded trader.
Start Evaluation Now →Gold Technical Overview
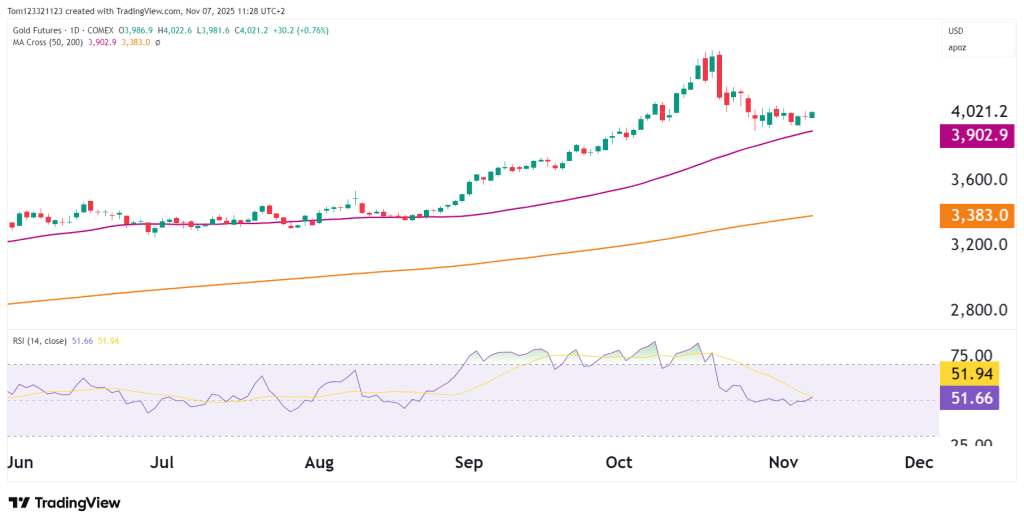
On the daily chart, gold has paused its pullback after dropping nearly 10% from the $4,400 highs. It’s now holding steady around $3,900–$3,950, right at the 50-day moving average (3,902.9), from which price has bounced repeatedly.
If this support breaks, the next key zone is $3,850–$3,800. A close below that could lead to a deeper drop toward the 200-day moving average near $3,383 — a level where bigger buyers may step in. This would be a worrying drop, however, and would likely be a big shock to the gold market.
On the upside, resistance is around $4,100, then $4,200. A break above that would likely mark the end of the correction and reopen the path toward $4,300–$4,400.
So far, this looks like a healthy consolidation after a sharp rally, not a trend reversal.
RSI & Momentum
As previously mentioned, the RSI is bouncing off the 50 level and is confirming the small candle price action, pointing toward less volatility. The RSI finding support at the 50 level coincides with the price finding support on the 50 moving average; bulls will be looking for both to hold support.
🎥 Watch: How to Pass the OneUp Trader Evaluation
Pass the 1-Step Evaluation and become funded. Get insights, rules, and tips from this trader who withdrew $73,000 in one go!
Gold Key Technical Levels
| Type | Level | Description |
|---|---|---|
| Resistance 1 | 4,100 | Near-term ceiling. |
| Resistance 2 | 4,200 | Key swing resistance. |
| Resistance 3 | 4,400 | Previous high. |
| Support 1 | 3,900 | 50-day MA. |
| Support 2 | 3,850 | Secondary support. |
| Support 3 | 3,383 | 200-day MA. |
Gold Probability Table (Next 2–3 Weeks)
| Scenario | Consolidation is likely as buyers and sellers balance momentum. | Notes |
|---|---|---|
| Range-bound trade between 3,900–4,100 | 50% | Consolidation likely as buyers and sellers balance momentum. |
| Upside break above 4,100 → 4,200–4,300 | 30% | Requires renewed risk aversion or weaker USD data. |
| Breakdown below 3,850 → test 3,800–3,700 | 20% | Would indicate sellers regaining control. |
Fundamentals
Gold is holding above $3,900, helped by a softer U.S. dollar and mixed Treasury yields. Traders are watching key macro events, U.S. inflation data, Fed comments, and geopolitical tensions.
The Fed appears to be on pause, but without clear rate-cut signals, gold remains range-bound for now. Still, demand stays strong due to Middle East unrest and weak global growth.
Short-term, gold’s next move likely depends on upcoming CPI and jobs data, which could shape expectations for early 2026 Fed policy.
Summary
Gold Futures are stabilizing after a sharp drop, with solid support around $3,900. Sellers are fading, but buyers haven’t confirmed a rebound yet.
If gold holds above the 50-day moving average, the uptrend stays intact. A break above $4,100 could restart the rally toward $4,300–$4,400. But if $3,850 breaks, more downside is likely.
This analysis is for educational and informational purposes only and does not constitute trading advice or a recommendation to buy or sell any futures contracts. Futures trading involves significant risk and may not be suitable for all investors. Always conduct your own research and consult with a licensed financial professional before making trading decisions.
