- This week’s analysis centers on the ascending triangle formation in the Dow and a flag formation.
- The YM index exhibits signs of a forthcoming bounce alongside other indices.
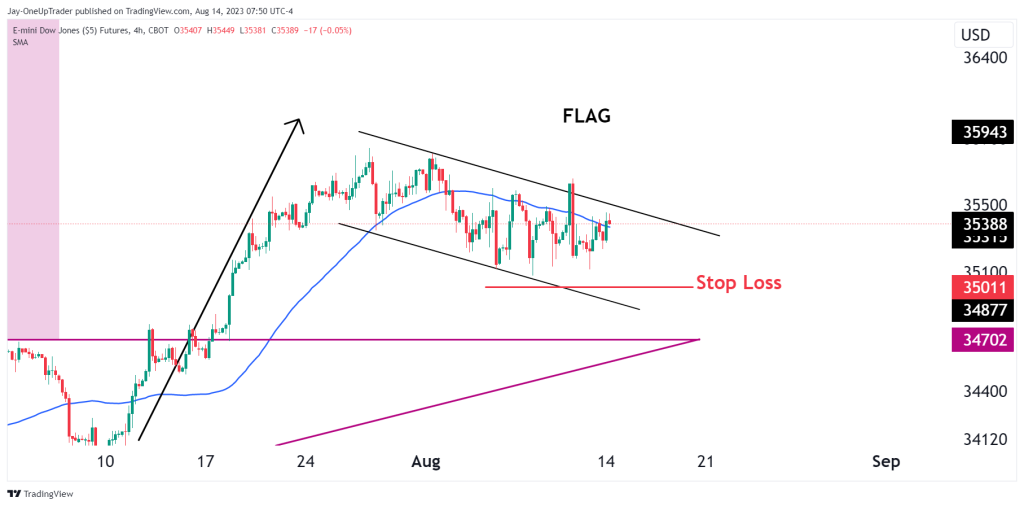
- Trade opportunities present with stops below 35011.
Recap
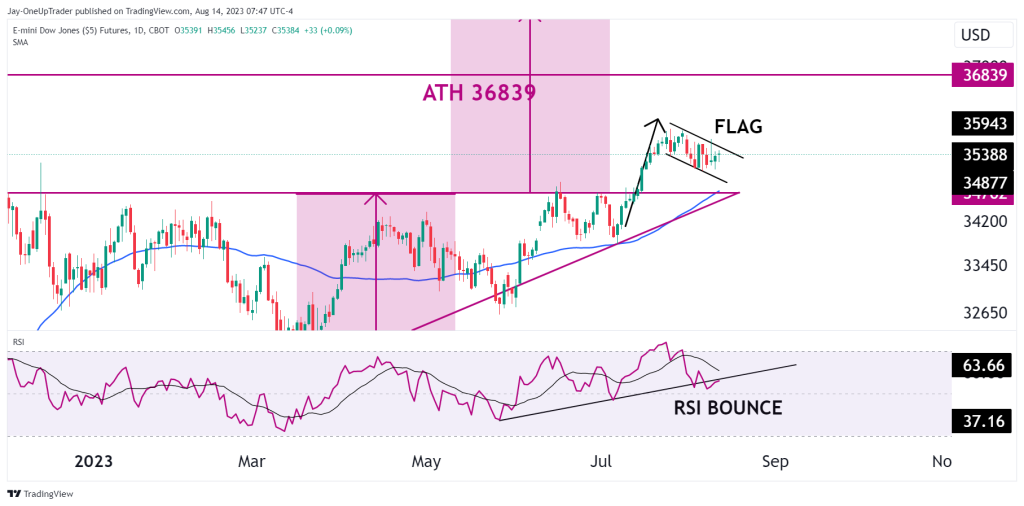
The ascending triangle formation in the Dow is still the main chart pattern that we are monitoring in this week’s analysis. Price broke out of the triangle sometime again, as shown in this article, and we have been patiently waiting for a pullback that might just be here.
YM looks poised for a bounce, along with other indices. Before we look at the potential long opportunity, let’s recap some of the technicals that could guide us moving forward.
The RSI on the daily chart gives us an interesting setup as the indicator has a small support trend line that it could be bouncing off as we speak. I signaled this on the chart with “RSI BOUNCE.”
The daily chart has also formed a similar appearance to that of a flag pattern. The steep rally has been followed by a rollover in price. A bullish break above $35845 would very likely send YM to all-time highs. This couples the ascending triangle pattern with the flag.
Trade Opportunity
I have gone down to the 4 hourly chart for the trade opportunity. It is a simple one where traders that are bullish on YM could go long above 35100. A stop can be placed at 35011 or lower, depending on risk tolerance. Targets could be set at all-time highs and then 37800.