


Introduction
Gold Futures (GC) have extended gains since our previous analysis, as buyers regained control following a strong rebound off the 50-day moving average. The yellow metal has now risen for a third consecutive session, suggesting that the recent pullback may have reached a floor near $3,900, where there is some support.
Bulls appear to be taking control again and are looking to target the all-time highs. Let’s take a closer look at the technicals and what they are saying.
Technical Analysis
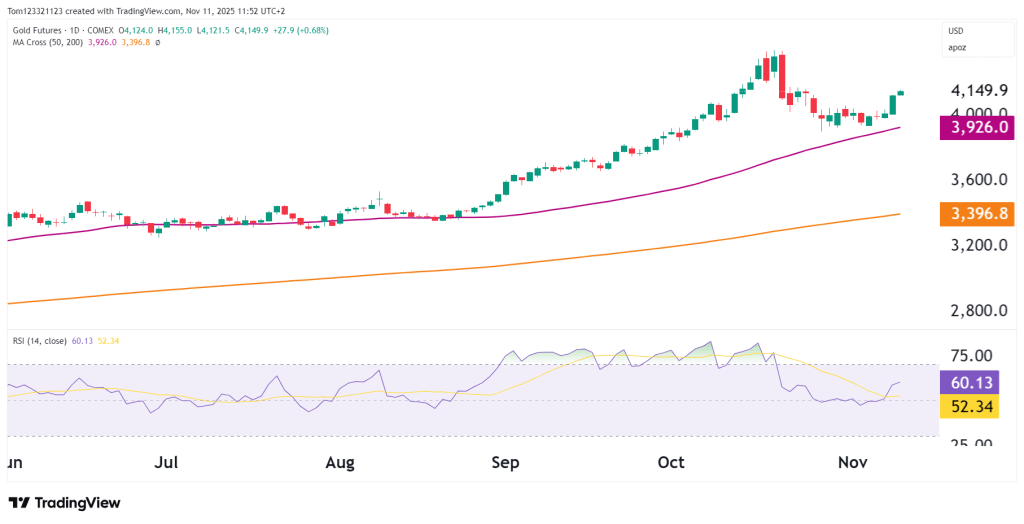
Gold has bounced off the important $3,900 support area, near the 50-day moving average ($3,926), signaling a shift in short-term sentiment after the late-October dip. This recovery puts gold back above its short-term trend line for the first time in nearly two weeks, improving the technical outlook.
The next hurdle is $4,160–$4,180, where sellers previously stepped in. A close above this zone would likely confirm the uptrend is back on, with room to push toward $4,250–$4,300.
Key support remains at $3,900–$3,880. A break below could weaken the outlook, but that risk looks low for now given recent strength.
Overall, gold is back on the rise and the short-term setup looks bullish.
RSI & Momentum
The RSI has bounced off the 50 line and is moving up, coinciding with the bounce from the 50-day moving average. The relative strength index was in overbought territory since the start of September before dropping again, so bulls have a decent target to aim for from here.
🎯 Ready to Prove Your Skills?
Start your 7-day free $100K evaluation with OneUp Trader and take the first step toward becoming a funded trader.
Start Evaluation Now →Gold Key Technical Levels
| Type | Level | Description |
|---|---|---|
| Resistance 1 | $4,160–$4,180 | Immediate resistance. |
| Resistance 2 | $4,250–$4,300 | October peak. |
| Support 1 | $3,900–$3,880 | 50-day MA. |
| Support 2 | $3,750 | Intermediate support. |
| Support 3 | $3,396 | 200-day MA. |
Probability Table (Next 2–3 Weeks)
| Scenario | Estimated Probability | Notes |
|---|---|---|
| Continuation higher to $4,180–$4,250 | 55% | Momentum improving above 50-day MA, RSI supports upside follow-through. |
| Consolidation between $3,900–$4,150 | 30% | Possible short-term pause after strong rebound. |
| Breakdown below $3,880 → retest $3,750 | 15% | Only likely if dollar strength returns or yields spike. |
Gold Fundamentals
Gold’s rebound is supported by better risk sentiment, a softer U.S. dollar, and easing Treasury yields — all of which help boost demand for non-yielding assets like gold.
Markets are now eyeing potential Fed rate cuts by mid-2026, while geopolitical tensions and steady central bank buying continue to support gold’s longer-term outlook.
Still, a hotter-than-expected U.S. inflation print could stall momentum by reviving hawkish Fed bets and lifting the dollar.
Summary
Gold Futures have regained short-term momentum, bouncing off $3,900 and moving back above the 50-day moving average. Rising RSI and strong price action show buyers are back in control, with resistance at $4,160–$4,180 in sight.
A break above that could lead to a retest of $4,250–$4,300, while holding $3,900 remains key for bulls.
Overall, gold looks to be in a steady recovery, with the trend favoring buyers as long as it stays above the 50-day average.
This analysis is for educational and informational purposes only and does not constitute trading advice or a recommendation to buy or sell any futures contracts. Futures trading involves significant risk and may not be suitable for all investors. Always conduct your own research and consult with a licensed financial professional before making trading decisions.