


Introduction
In our previous analysis on November 26th, we looked at how gold had reclaimed short-term momentum after bouncing off the 50-day moving average and was attempting to push toward the $4,250 resistance zone. Since then, gold has continued to grind higher, but price action has become indecisive and has low volatility. We see this with the small candlesticks on the daily chart. Traders appear unwilling to commit aggressively in either direction until the Federal Reserve provides fresh clarity on rates and inflation expectations.
Let’s break down the technical analysis.
Technical Overview
Gold Daily Chart – GC Technical Structure
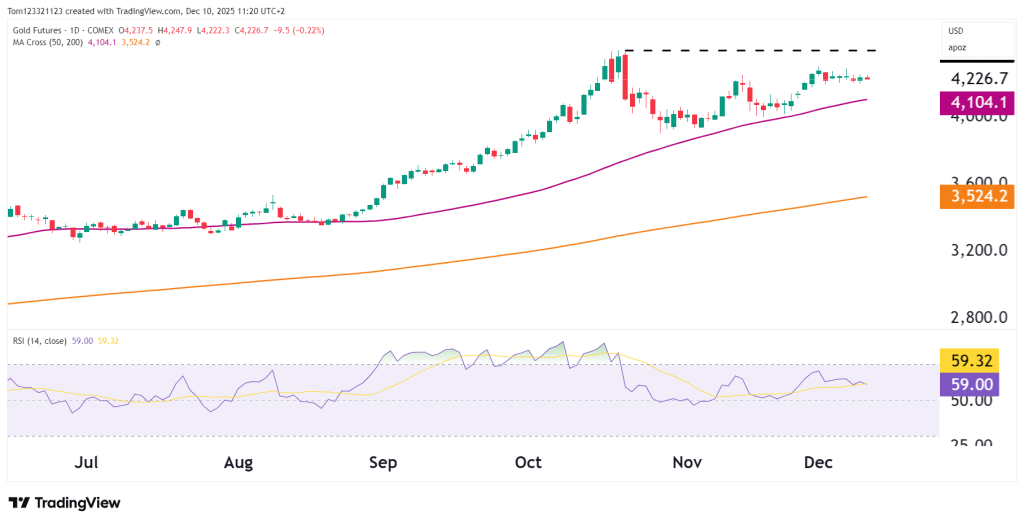
Gold is currently trading around $4,225, with low volatility just below the $4,250–4,280 resistance zone. Despite the stall, the structure remains constructive, as bulls have successfully defended the 50-day moving average (now near $4,105), an important level that we looked at in the previous analysis for protecting the uptrend.
Since the late-November pullback, price has produced a series of higher lows, but the lack of follow-through above ATH resistance (~$4,300) suggests buyers are hesitant ahead of Wednesday’s Fed decision. RSI has recovered to 59, similar to where it was during late October’s breakout, hinting at improving momentum but not yet at an overextended level.
Key Technicals
- Resistance remains firm at $4,250–4,280, with the ATH zone near $4,300 as the next major upside target.
- 50-day MA support at $4,105 continues to hold as an important signal that buyers remain in control.
- Price is clustering tightly beneath resistance, a common pattern ahead of major catalysts, often leading to sharp breakouts once uncertainty clears.
- The 200-day MA at $3,524 remains far below, confirming gold is firmly in a long-term bullish structure.
Key Technical Levels
| Type | Level |
|---|---|
| Resistance 1 | $4,250 |
| Resistance 2 | $4,280–4,300 |
| Support 1 | $4,105 |
| Support 2 | $3,980–4,000 |
| Support 3 | $3,750–3,780 |
Probability Table (Next 2–3 Weeks)
| Scenario | Estimated Probability | Notes |
|---|---|---|
| Breakout toward $4,280–4,300 (ATH retest) | 45% | Requires a neutral-to-dovish Fed and continued risk hedging. |
| Consolidation between $4,105 and $4,250 | 40% | Most likely if Fed maintains tight but non-committal tone. |
| Breakdown below $4,105 → move toward $4,000 | 15% | Would require a hawkish Fed or strong dollar rebound. |
Fundamental Context
Gold is stuck in a quiet, directionless move as traders wait for Wednesday’s Fed meeting. The decision will shape expectations for real yields, the dollar, and rate cuts going into early 2026. Inflation has cooled, but the labor market is still solid, so the Fed’s tone could move markets quickly.
A more dovish message could pull the dollar lower and push gold toward its $4,300 high.
A more hawkish message about lingering inflation could lift yields and pull gold back toward the $4,105 support area.
In short, the chart looks steady for now, but the Fed meeting is the big driver.
Summary
Gold futures remain in a low volatility phase just below resistance levels, with price supported firmly above the 50-day moving average. As we noted in the prior analysis, gold continues to build a base for a potential breakout, but recent price action reflects hesitation as markets count down to the Fed’s rate decision. A move above $4,250 would likely open the path toward a retest of the $4,300 ATH, while failure to hold $4,105 would shift momentum back toward the November lows.
This analysis is for educational and informational purposes only and does not constitute trading advice or a recommendation to buy or sell any futures contracts. Futures trading involves significant risk and may not be suitable for all investors. Always conduct your own research and consult with a licensed financial professional before making trading decisions.