

Gold futures have experienced significant volatility in 2024, driven by economic and geopolitical factors. After closing 2023 at $2,135.39 per ounce, gold prices have continued to rise, reaching new highs. As of mid-May 2024, gold futures were trading around $2,316 to $2,322 per ounce, with fluctuations influenced by the strength of the U.S. dollar and investor anticipation of key economic data releases (J.P. Morgan | Official Website) (Trading Economics) (The Gold Forecast).
Key factors impacting gold prices this year include expectations of Federal Reserve interest rate cuts, which are anticipated to begin in the second half of 2024. This potential easing of monetary policy has buoyed gold prices, with forecasts suggesting that prices could peak at around $2,400 to $2,500 by the end of the year (J.P. Morgan | Official Website) (GoldSilver). The appeal of gold as a safe-haven asset amid global economic uncertainties and geopolitical tensions has also contributed to its strong performance.
Analysts from major financial institutions have varied predictions for gold’s trajectory. For instance, Bank of America and Citigroup forecast that gold could reach $2,400 by the end of 2024, while UBS projects a slightly lower target of $2,200 (GoldSilver).
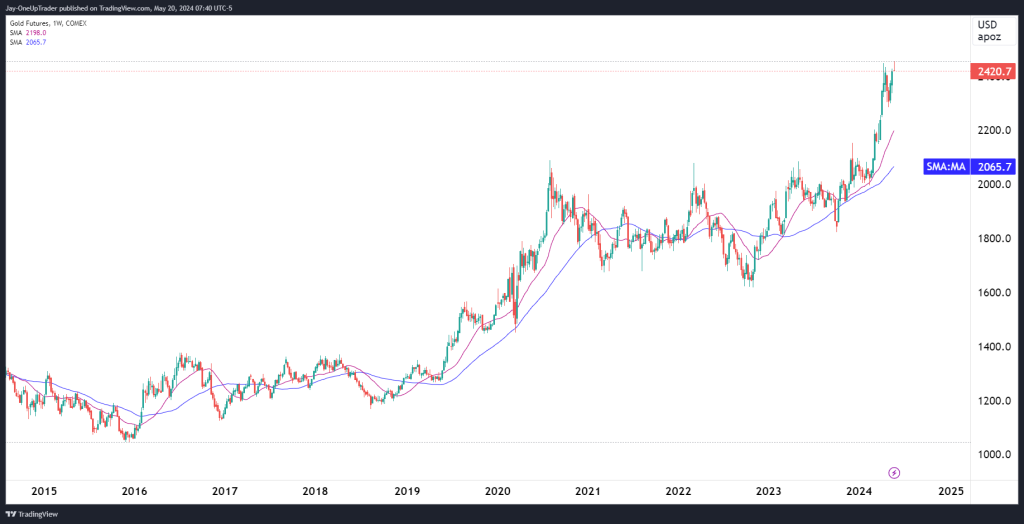
Weekly Chart
Technical Analysis of Gold Futures
Current Market Overview:
Gold futures have been in a strong uptrend, currently trading at $2,420.7. The overall market sentiment remains bullish with bulls searching for new highs constantly.
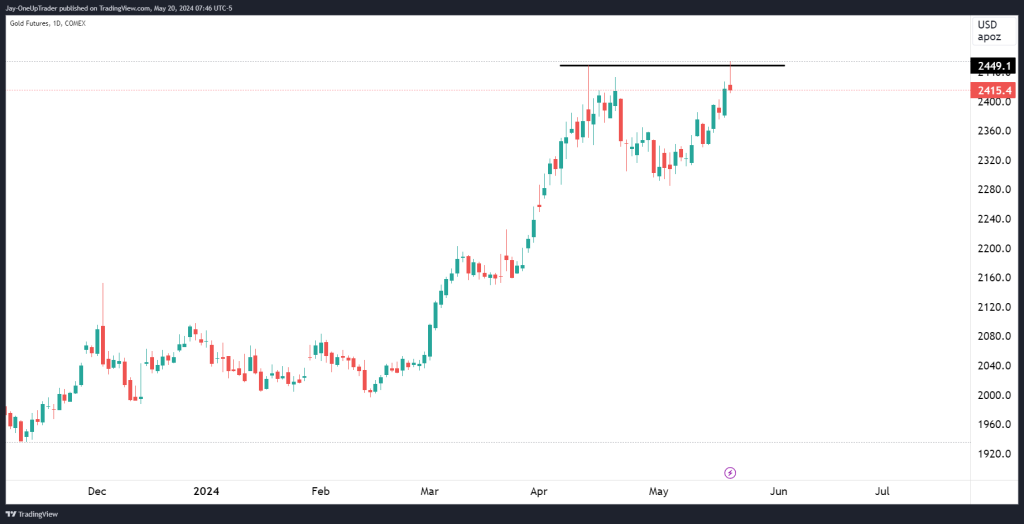
Gold broke its all-time high this morning after swiftly retracing, painting a picture of a potential double-top formation. The sentiment remains firms bullish however and shorts are probably not the right play in the medium to long term.
- 50-day SMA (in blue): Currently at $2,190.0
- 200-day SMA (in purple): Currently at $2,065.7
- Bullish Signal: The 50-day SMA is above the 200-day SMA, indicating a golden cross, which is a strong bullish indicator.
Support and Resistance Levels:
- Immediate Support: $2,300 (psychological level and recent consolidation area)
- Strong Support: $2,135.39 (previous all-time high)
- Immediate Resistance: $2,420.7 (current high)
- Potential Resistance: $2,500 (next psychological level and potential target)
Trading Strategy:
- Long Position: Consider entering a long position if the price sustains above the immediate support of $2,300. Look for confirmation of the uptrend with continued higher lows and higher highs.
- Stop-Loss: Place a stop-loss below $2,300 to protect against downside risk.
- Target: Initial target at $2,500, with potential for higher levels if bullish momentum continues.
- Risk Management: Be cautious of short-term corrections and potential volatility around major economic data releases and Federal Reserve announcements.

