

Introduction
As the conflict continues in the middle east, the price of crude oil keeps moving higher. This is due to supply disruption as the Strait of Hormuz remains shut. Petrol prices are rising across the globe and some analysts are predicting $200 Oil if the conflict does not find a resolution fast.
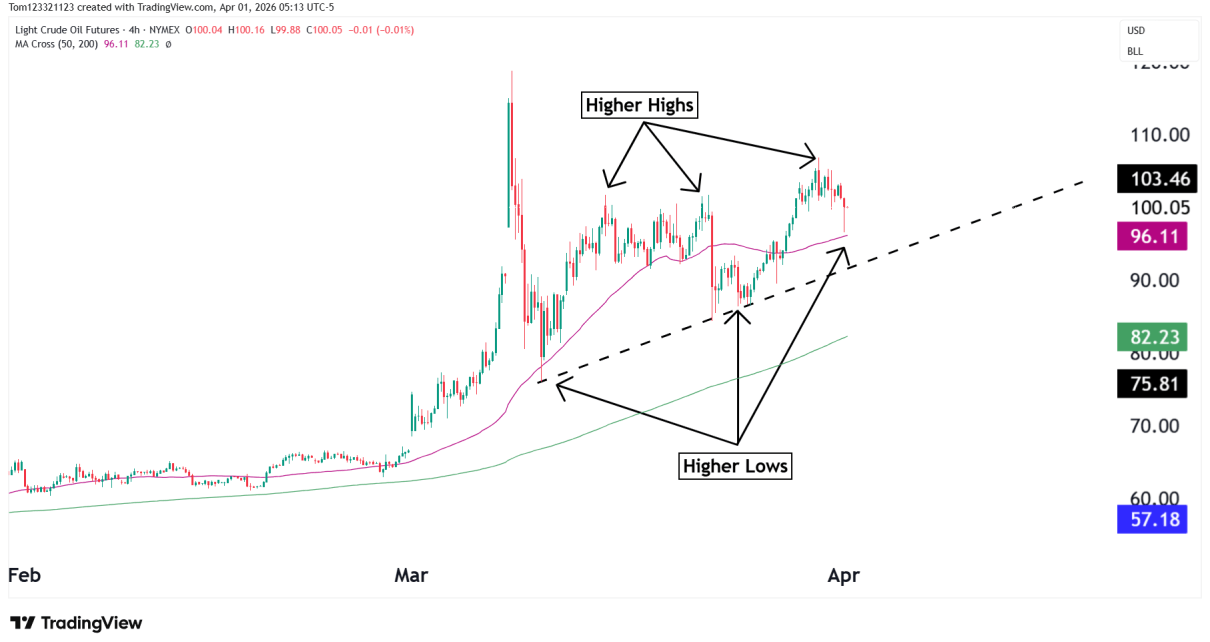
For traders looking to profit from the volatility in crude oil, here is a technical analysis of the 4 hourly chart:
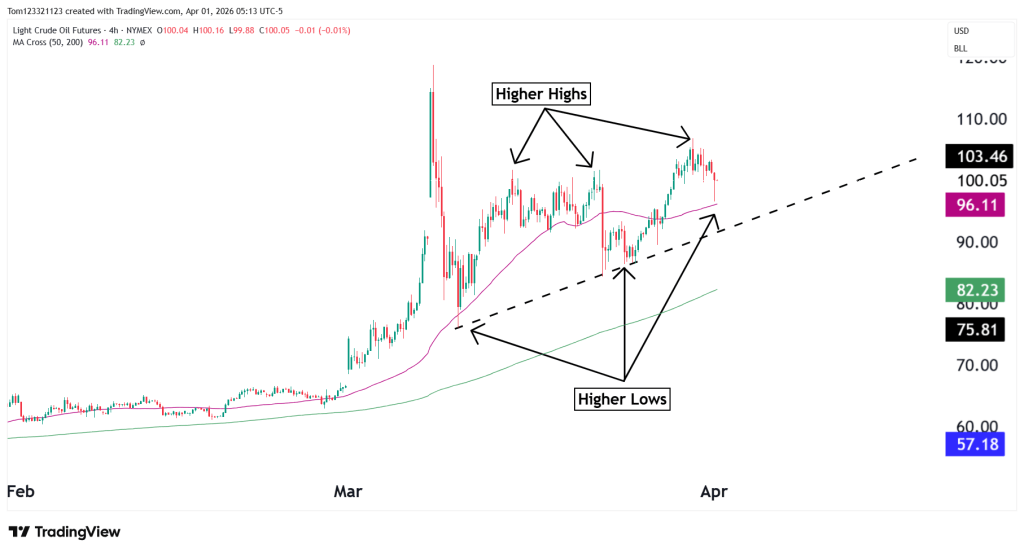
The 4 hourly chart shows a clear bullish trend with the 50 MA acting as support and price well above the 200 MA. As the conflict started, there was extreme volatility as the price rallied from $55 – $120 in the space of a few weeks. Now that price discovery has stabilized, we can see a clearer picture of what is going on with the trend.
Buying opportunities can be found at any pullback; for now, the 50 MA looks like a good starting point. The chart looks determined to push above $120 at the moment so any short selling would be heavily fighting the trend.
Bulls are firmly in control as long as price remains above the 200 day MA.
Possible Trades
| Trade | Entry | Stop Loss | Target | Why |
|---|---|---|---|---|
| Buy the dip (best) | Around 95–97 | Below 93 | 103–110 | Uptrend |
| Buy breakout | Above 103.5 | Below 100 | 108–112 | New highs |
| Sell if trend breaks | Below 94 | Above 97 | 88–82 | Uptrend failed |
This analysis is for educational and informational purposes only and does not constitute trading advice. Futures and forex trading involve significant risk and may not be suitable for all investors. Always conduct your own research before making trading decisions.
