Overview
The charts below give us monthly, weekly, and daily S&P 500 E-mini Futures (ES) technicals. We will analyze the key levels, trends, and indicators to establish potential trade setups.
Monthly Timeframe Analysis
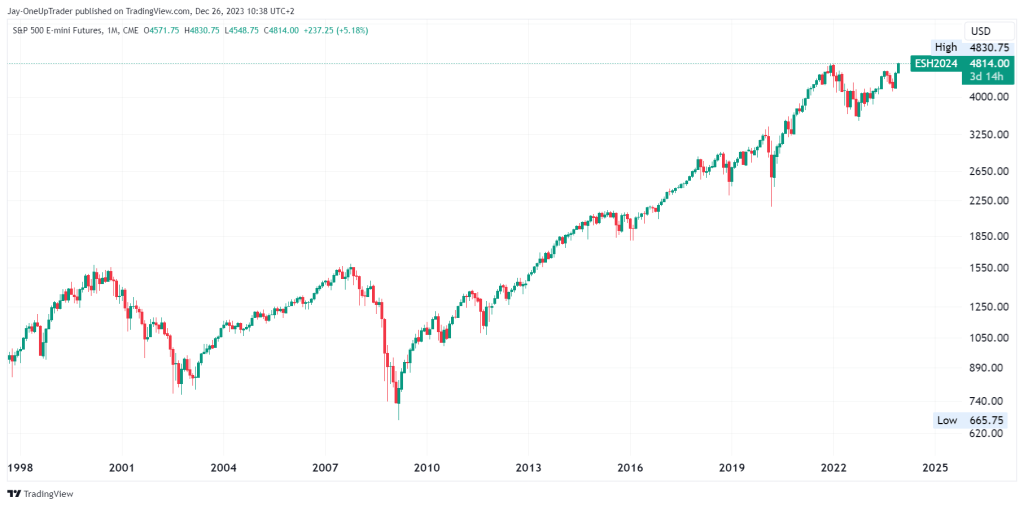
The monthly chart reveals a long-term uptrend, with the price consistently forming higher highs and higher lows—a bullish signal. The recent high at 4830.75 could serve as a significant resistance zone. If the price sustains above this level, it would indicate continued bullish momentum.
Key Level to Watch:
- Resistance: 4830.75 (Recent high)
Weekly Timeframe Analysis
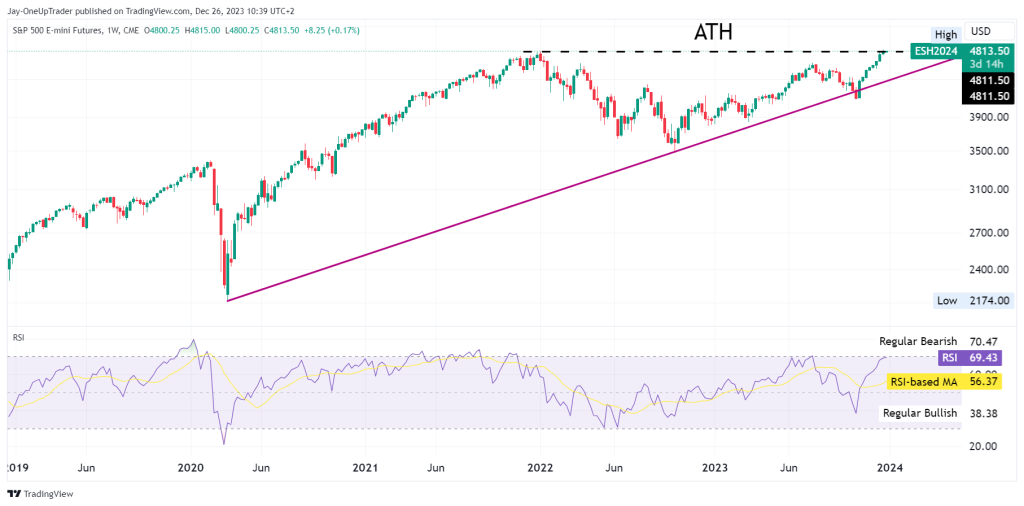
The weekly chart shows a rising trendline with three connections, each with a successful bullish bounce. The Relative Strength Index (RSI) on this timeframe is hovering around 69, close to overbought but without a bearish divergence, which suggests that the bullish sentiment is still strong.
Key Level to Watch:
- Support: Trendline support, currently around the 4400 level
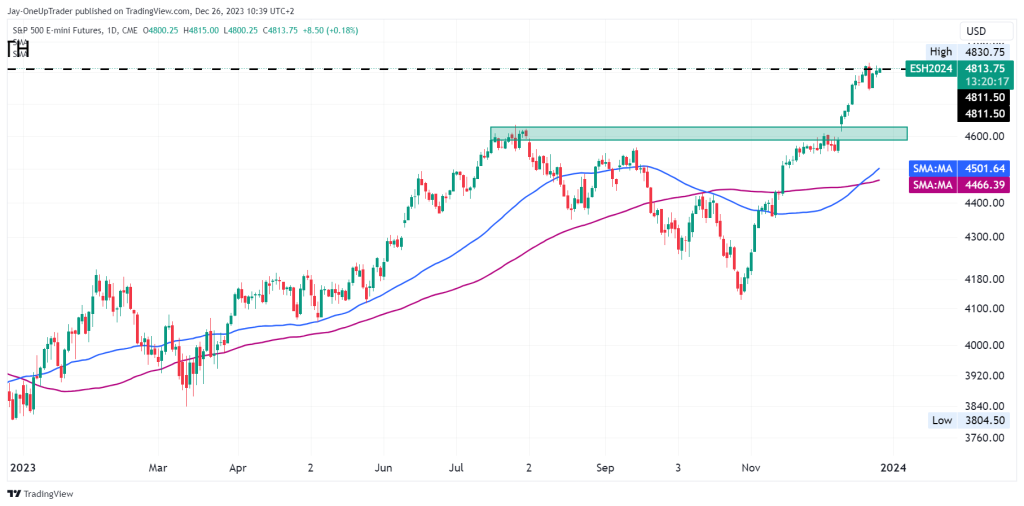
Daily Timeframe Analysis
On the daily timeframe, the chart shows a robust bullish structure with the price trading above both the short-term and long-term Simple Moving Averages (SMAs). The SMAs are trending upwards, giving us a bullish addition to our sentiment.
Key Levels to Watch:
- Resistance: 4830.75 (Aligns with the monthly high)
- Support: 4501.64 and 4466.39 (SMAs that could provide dynamic support)
Trade Setups
Bullish Scenario:
- Entry: A decisive breakout above 4830.75 with significant volume could be a viable entry point for a long position.
- Target: The next psychological level after 4830.75, which could be around 4900 or higher.
- Stop-Loss: A stop-loss could be placed below the breakout candle’s low or the nearest SMA support to manage risk.
Bearish Scenario:
- Entry: If a rejection at the 4830.75 resistance occurs with an accompanying high volume, a short position could be considered.
- Target: The initial target would be the trendline support on the weekly chart, around the 3900 level.
- Stop-Loss: A stop-loss may be set above the highest point of the rejection candle or above the 4830.75 resistance to limit potential losses.
Opinion
Given the current technicals, there is a higher probability of bullish continuation. The market structure on all timeframes points to an established uptrend. However, traders should be cautious of any potential reversal signals as the price approaches all-time highs, where profit-taking and reversals can often occur.