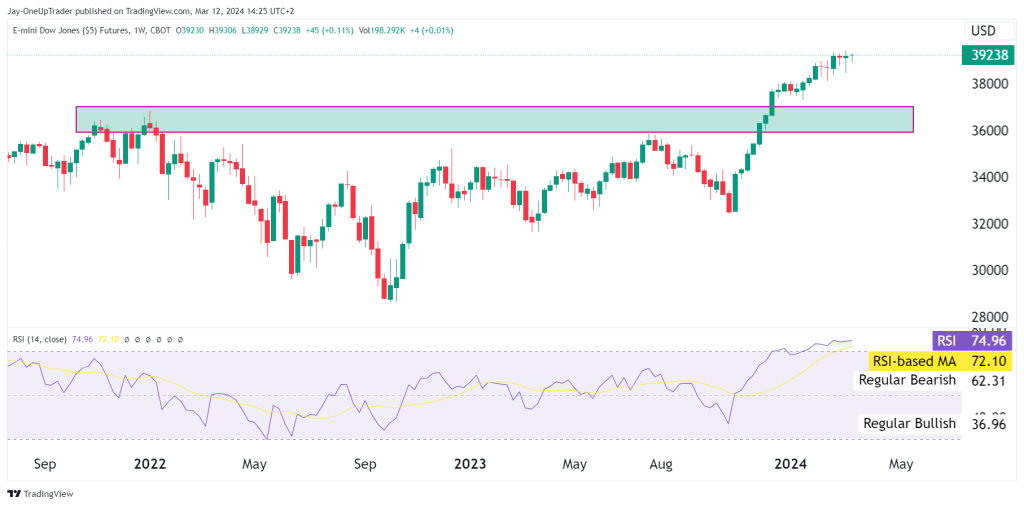
Examining the weekly chart, the index has firmly established support within the 36,000 region, demonstrated by the green box marking previous resistance now turned support.
The Relative Strength Index on the weekly timeframe reflects strong buying interest with a reading above 74. While this indicates a powerful bullish push, traders should be cautious of the potential for overbought conditions that could bring about a temporary pullback.
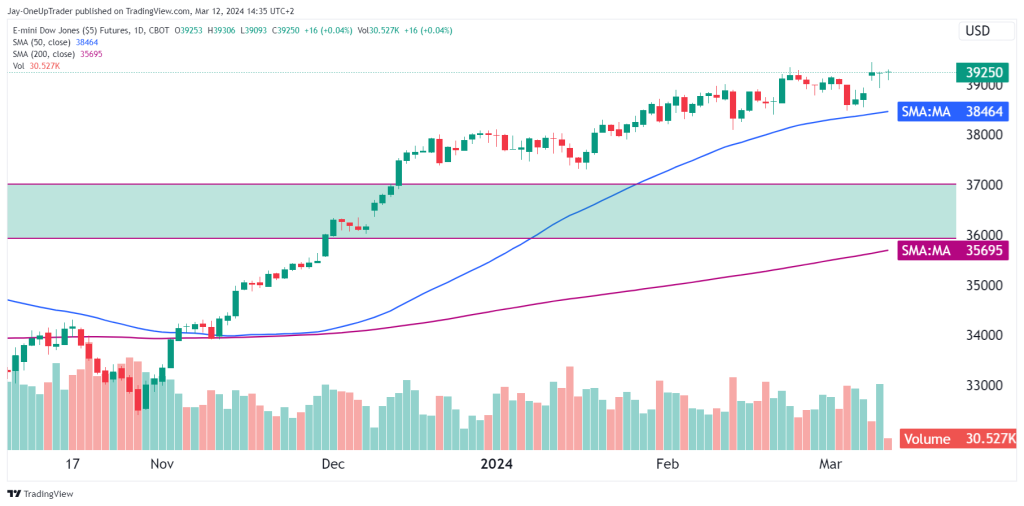
Shifting to the daily, we see the Dow maintaining well above the 50-day and 200-day Simple Moving Averages, placed at approximately 38,463 and 35,695, respectively.
Potential Trades:
- Bullish Continuation: Traders might consider a long position if the price remains above the recent consolidation range on the weekly chart, targeting new highs above $39,250. A reasonable stop-loss can be placed below the 50-day SMA on the daily chart to protect against a false breakout.
- Breakout Trade: Another opportunity is to enter a long trade on a confirmed breakout above the current all-time high, with an initial profit target at $40,000, representing a significant psychological level. A stop-loss could be set below the breakout level to mitigate risk.
- Pullback Entry: For traders looking for a more conservative entry, a pullback towards the 50-day SMA on the daily chart may provide a lower-risk entry point, with the same upside target near $40,000 and a stop-loss just below the 200-day SMA.
Overall Rating: Bullish. Both the weekly breakout and daily SMA support indicate the Dow’s upward momentum is likely to continue. However, monitoring the RSI for any signs of divergence or a move into extreme overbought territory is essential, as this could precede a short-term pullback or consolidation before further gains. Traders should remain nimble and adjust stop-losses accordingly as the market reaches new heights.