CL Volatility
We havent seen much volatility after the very uncomforting attempt on former US President Donald Trumps life this morning. The week ahead could be a very hostile one after this event on the weekend as well as OPEC monthly report and EIA report this week. Let’s see if we can position ourselves properly with technical analysis.
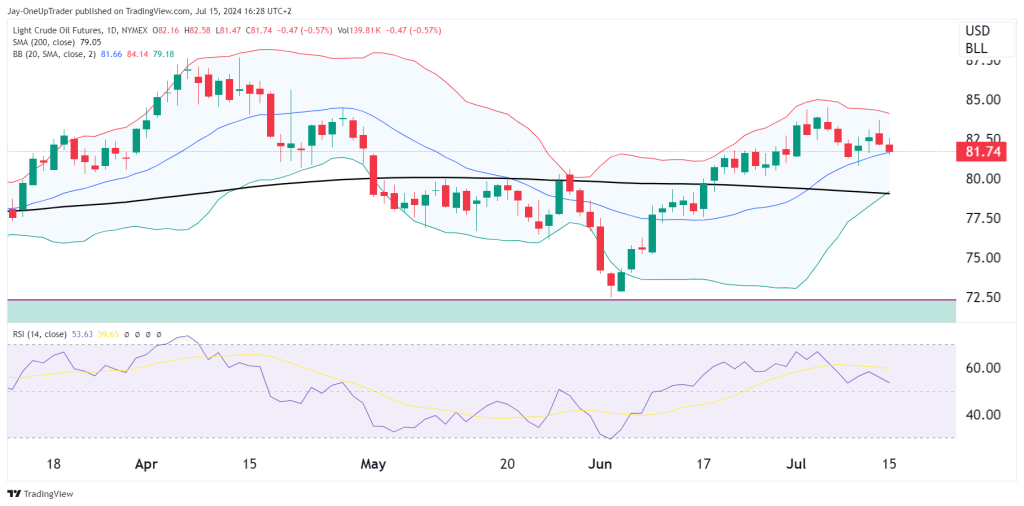
Daily Chart
CL broke above the 200 SMA in the middle of June and has remained above for a month now. The SMA also has been sitting sideways, showing us that there really is no solid long-term trend present at the moment.
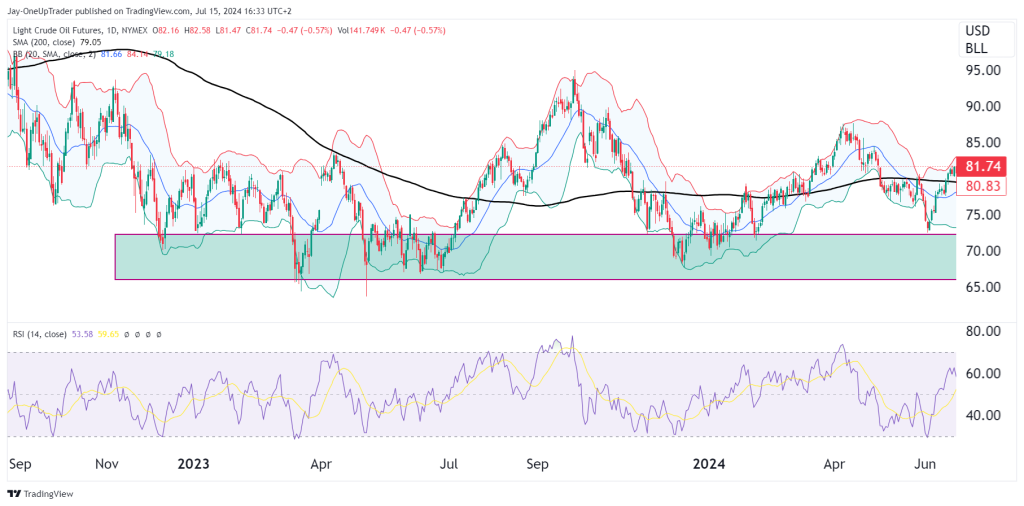
One interesting thing to look at is the support that keeps bouncing the price at around $72.50. Below is a zoomed-out daily chart, you can see that since the start of 2023 every time the price testing the support level it bounced out with strength.
From here, there could be a short trade opportunity as we have seen some small bearish candles on the daily. Placing a stop above $85 and targeting first the 200 sma and then possibly the $72.50 support zone could be a good trade to take. No financial advice.
Conclusion
Keep an eye out for volatility this week, as things could get out of hand at any moment. Make sure you are not risking more than you can afford to lose, and always think in probabilities. If you have any trade suggestions or technicals you would like to send us, please do so on our Instagram here, and you could receive a 25% discount in return if the analysis is good enough to feature on our blog/Instagram account. Good luck for the week to come!