


Introduction
Crude oil futures (CL) extended their decline this week, slipping another to $56.37, deepening the bearish move that began earlier in October. This follows the breakdown below the $60.00 support zone that we mentioned in the October 13 analysis. Just what the bears were aiming for has happened as the move below $61 zone was too much for the bulls to handle and we have seen price slip to the next zone at $56.
Technical Overview
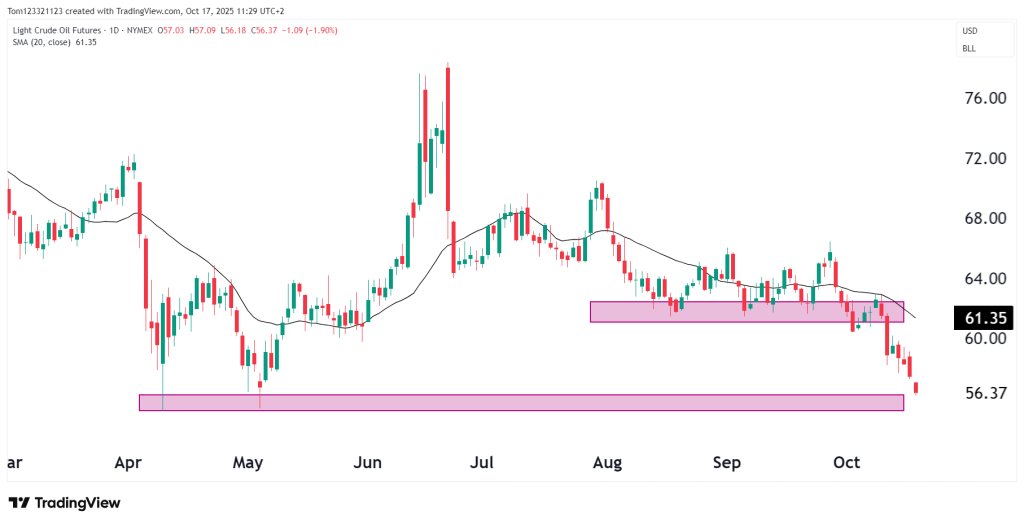
Crude oil has broken decisively below the $60–$61 resistance zone, confirming the bearish price action. Price broke through the lower end of the $61 support, and the selling pressure was too strong for the bulls, leading to the $55.50-$56.00 zone being tested. This is a key support zone for the year and time will tell if price can sustain it or not.
The 20-day SMA, now at $61.35, has sloped lower after consolidation since late August.
Momentum remains negative. Sellers are in control, and any bounce toward $60–$61 will likely meet strong resistance after this week’s sharp drop.
Key Technical Levels
| Type | Level | Description |
|---|---|---|
| Immediate Resistance | $60.00–$61.50 | Former support turned into resistance |
| Support 1 | $56.00 | Current zone of price action; May swing low |
| Support 2 | $53.00 | Next structural support if breakdown continues |
Probability Table (Next 2–3 Weeks)
| Scenario | Estimated Probability | Notes |
|---|---|---|
| Bearish continuation toward $55–$53 zone | 50% | Trend, momentum, and fundamentals favor further downside. |
| Short-term rebound toward $60.00 | 35% | Oversold RSI could fuel a corrective bounce. |
| Recovery above $61.50 (trend reversal) | 15% | Unlikely without stronger demand or geopolitical risk resurgence. |
Fundamentals
The recent drop in oil prices lines up with a shift in global risk sentiment. Tensions between Iran and Israel have eased, which has reduced supply fears that were pushing prices up earlier this month.
At the same time, U.S. crude inventories came in higher than expected, according to the latest EIA data. This added to the view that there’s plenty of oil available in the short term.
Demand also looks weak. Slower industrial activity in China and falling factory output in Europe have kept global demand expectations low.
Adding to the pressure, a stronger U.S. dollar weighs on commodity prices, making oil more expensive for buyers using other currencies.
Still, traders are watching closely to see how OPEC+ might respond if prices fall too far. If oil dips below $55, the group could step in with new production cuts, which might act as a short-term support and spark a bounce in prices.
Summary
Crude oil futures have confirmed a clean technical breakdown below $60, extending the bearish structure outlined in the prior analysis. Momentum remains clearly negative, with the next test centered around $55.50–$56.00, a key support zone.
Unless price can recover and hold above $61.50, the bias remains bearish in the short to medium term, with downside risk toward $53.00.
This analysis is for educational and informational purposes only and does not constitute trading advice or a recommendation to buy or sell any futures contracts. Futures trading involves significant risk and may not be suitable for all investors. Always conduct your own research and consult with a licensed financial professional before making trading decisions.
