


Introduction
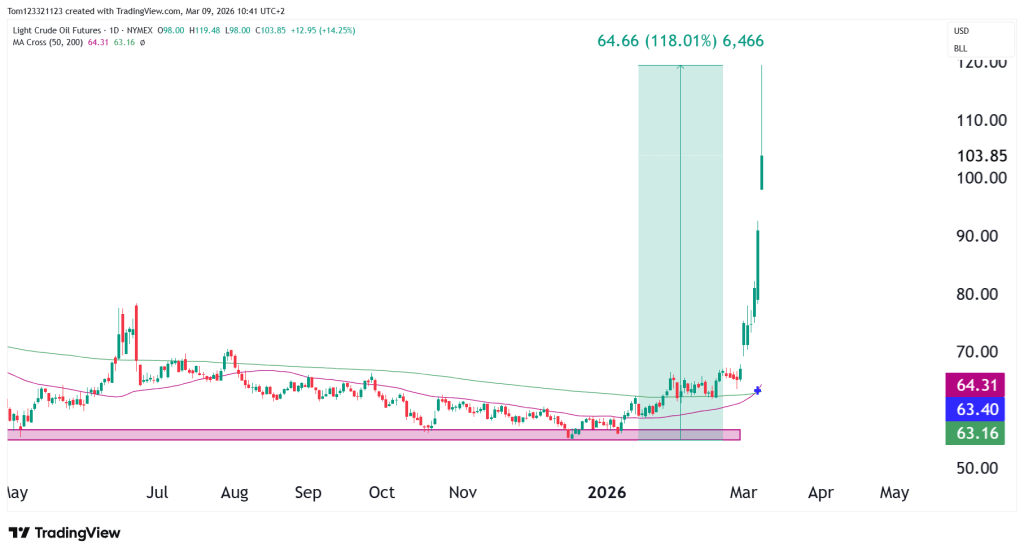
Crude Oil futures (CL) exploded higher after the weekend, with price ripping from the mid-$60s to above $100. On the daily chart, we can see a violent repricing, and moves like this almost always come from a major catalyst rather than from technicals alone.
The chart shows a market that had been sitting for weeks around the $54–$56 support zone, then began lifting through the moving averages before the weekend gap and impulsive push higher.
The move occurred because of a dramatic escalation of the conflict in the Middle East. This has created supply disruption fears, shipping risk, and sanctions. There are also attacks on oil infrastructure and Iran has threatened to continue these attacks across the Gulf.
For funded traders, that distinction matters. This is not just a chart pattern breaking out. This is a market that has likely entered a headline-dominant regime, where technical levels still matter, but news can override them very quickly.
Market Structure & Trend
Daily Chart
The price action over the past two weeks has been purely driven by fundamentals. It is difficult to do a genuine technical analysis in a market environment like this due to that reason so the real question is whether this becomes:
- a sustained geopolitical uptrend,
- a consolidation after repricing,
- or an exhaustion spike that retraces sharply.
That is the framework traders need to use now.
Moving averages
The chart shows the 50-day MA near $64.29 and the 200-day MA near $63.16, with price now trading massively above both, which tells us two things.
First, the prior bear phase is clearly over for now.
Second, price is now extremely extended from its mean. Markets can stay extended longer than expected during war-driven moves, but they also become much harder to chase from a risk-management perspective. This means that if traders have not already ‘got in’, it is difficult to find an entry point now because of how far it has extended. It is not impossible, but traders need to keep an eye on their risk and understand what they are getting into if they participate in the market at this time.
Key Technical Levels for Crude Oil
Immediate Resistance
$110–$120
This is now the immediate resistance band because price already probed this zone intraday. It is the first area where traders should expect aggressive profit-taking, heavy volatility, and two-way trade.
If war escalation continues, CL can absolutely trade back into this region quickly. But it is also where blow-off behavior becomes more likely.
$125+
If the geopolitical situation worsens materially, the next leg could extend beyond the recent spike highs. At that point, price discovery takes over, and technical resistance becomes even less reliable.
Support
$100–$102
This is the first big near-term area to watch because it lines up with the current closing zone after the spike. Holding here would show strong acceptance of the repricing.
$90
This is a natural psychological and structural support area. If crude pulls back but remains above $90, bulls will still have strong control of the tape.
$75–$80
This is the first deeper retracement zone that could come into play if the headline premium cools. A move back into this area would still leave the bigger breakout structure intact.
$64–$65
This is where the 50-day moving average sits. In normal conditions this would be a key support area, but after a move like this, it is far below the current market and mainly serves as long-term reference rather than a practical short-term trade level.
$54–$56
This remains the major base and long-term invalidation zone. That is the demand area from which this whole move began.
How Funded Traders Should Think About This Move
This is where the chart becomes most useful.
For funded traders, the biggest mistake after a move like this is treating it like a normal trend day or a standard breakout pattern. It is neither. This is a headline-sensitive market with expanded range and elevated gap risk.
A few practical points matter here.
Do not confuse direction with entry quality
Yes, crude is bullish right now. But buying after a vertical expansion can still be a poor trade if the entry is too late and the stop has to be too wide. In these conditions, being right on bias does not always translate into good execution.
Expect extreme intraday volatility
When crude reprices on geopolitical news, the market often starts moving in multi-dollar swings rather than normal daily rotations. Traders need to size smaller and respect the fact that normal stop placement may no longer work.
Focus on acceptance or rejection of the new range
The best thing to watch now is whether CL can build support above $100. If it can, then this is more likely a sustained repricing event. If it cannot and quickly loses that zone, then the spike may start behaving more like an exhaustion event. From there, any new developments in the Middle East could result in a new spike in CL, something very difficult to predict.
Final Takeaway
Technicals are less reliable in the current market conditions, and traders can take advantage of the volatility, but they also need to be on high alert for new developments in the Middle East. Keep an eye on the news, and if you are going to trade CL, monitor your risk closely.
This analysis is for educational and informational purposes only and does not constitute trading advice or a recommendation to buy or sell any futures contracts. Futures trading involves significant risk and may not be suitable for all investors. Always conduct your own research and consult with a licensed financial professional before making trading decisions.
