


Trend Structure
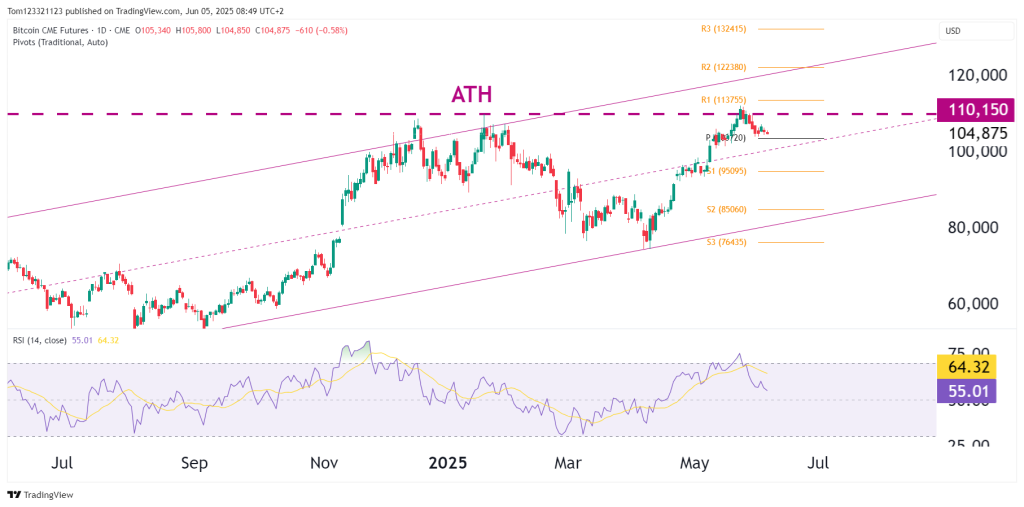
- BTC is trading within a well-defined rising channel. The recent rejection near the upper boundary of the channel lined up with resistance from:
- ATH horizontal level (110,150)
- R1 pivot (113,755)
- The current pullback is healthy, not impulsive, so it could just be some profit taking. What would be more concerning is if we saw a very sharp pullback from the ATH.
Key Support Levels
| Level | Comment |
|---|---|
| 102,720 (Pivot) | Immediate short-term support; being tested. |
| 95,095 (S1) | Stronger horizontal |
| 85,060 (S2) | Lower support level of the channel uptrend. |
Resistance Levels
| Level | Comment |
|---|---|
| 110,150 (ATH) | Psychological and technical ceiling. |
| 113,755 (R1) | Short-term price rejection zone. |
| 122,380 (R2) | Upside breakout target post-ATH. |
Market Psychology
- After the strong May breakout, price rallied aggressively and now consolidates.
- This current setup resembles a bull flag or pennant, which could be bullish continuation, especially if RSI stabilizes and price holds above 102,000.
- However, the lack of follow-through post-ATH and fading RSI warns of momentum loss, typical before deeper pullbacks.
Trade Setups
Scenario A – Bullish Breakout Play
- Trigger: Daily close above 110,500 with increasing volume.
- Target: 122,000 (R2), then 132,000 (R3 top of channel).
- Invalidation: Daily close below 102,000 or break of rising channel support.
Scenario B – Pullback Buy Setup
- Zone: 95,000–97,000
- Reason: Retest of S1 + mid-channel + previous breakout level
- Trigger: Bullish reversal candle or RSI bounce from 50
- Stop: Below 92,000 (prior swing low)
Bearish Risk Scenario
- A break below 95,000 would invalidate the bullish structure short-term.
- RSI falling below 50 while price breaks the channel would open the door to S2 at 85,000, and eventually S3 ~76,000 as worst-case consolidation range.
Summary
| Timeframe | Bias | Key Signal |
|---|---|---|
| Short | Neutral-Bullish | Pullback within channel, testing Pivot. |
| Medium | Bullish | Holding structure; breakout possible. |
| Long | Bullish | Uptrend remains valid unless sub-85k. |

