

Introduction
We haven’t looked at 6C for a while, but there is an interesting pattern we can look at and learn from.
Let’s break down the analysis and find high-probability trade setups while explaining the bearish divergence pattern highlighted in the image. Before we go further, you can learn all about bearish divergence in the OneUp Trader beginner trading course here.
Technical Analysis
Bearish Divergence:
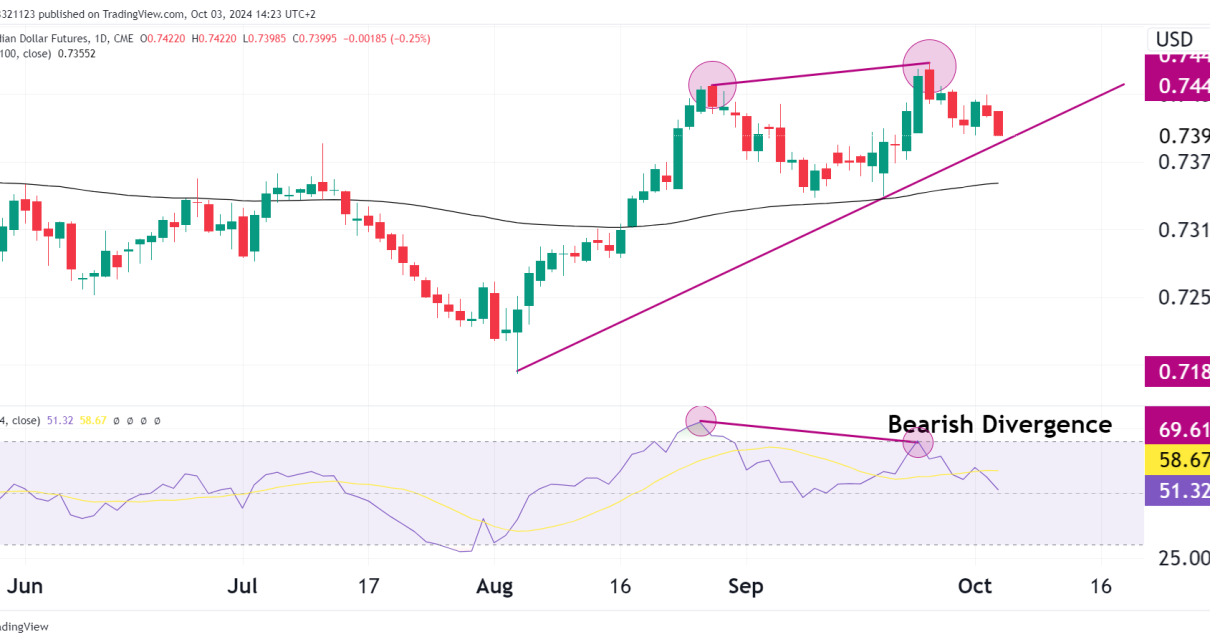
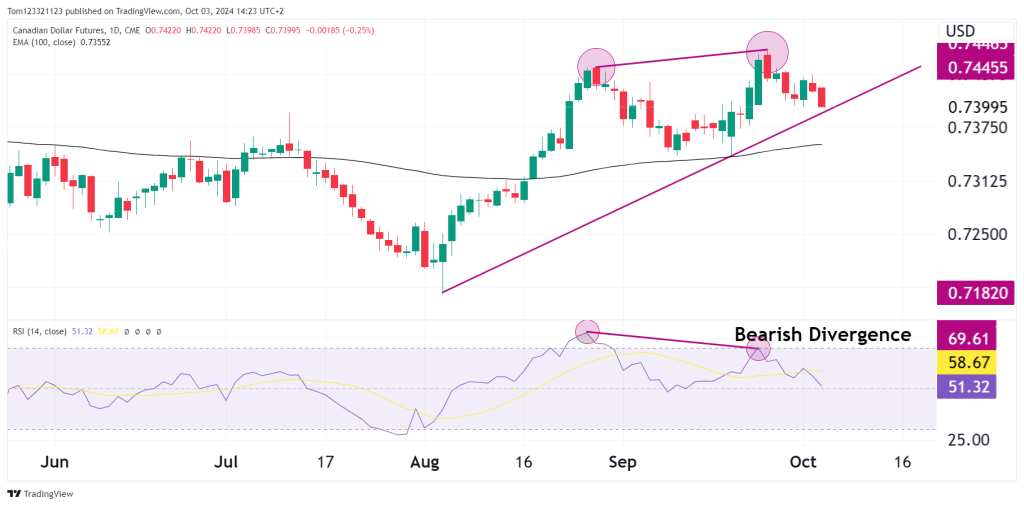
- What is it? A bearish divergence occurs when the price makes a higher high, but the indicator (in this case, the RSI) makes a lower high. This signals that the upward momentum is weakening, even though the price is moving higher.
We must stress that this does not necessarily mean the market will reverse. It simply means that there is a lack of buying pressure and the sellers are getting stronger. This is confirmed by the RSI do there is no need to take a short position.
In the course, we explain that this is not a short signal but rather a signal to NOT take longs until a floor or another bearish reversal is created.
Trendline and Support Levels:
There is a upward sloping trend line that is forming a possible rising wedge pattern. Generally a break below the support of the wedge leads price on a big dip but the pattern is not regarded as a high probability setup. If we see price drop below 0.734 then it is likely we see a bearish trend develop which would take some time for bulls to find a footing again and send prices above 0.746.
Trade Setups:
- Short Setup – Based on Bearish Divergence:
- Entry Point: Look for a break below the upward sloping trendline (around 0.7380 – 0.7375). This would confirm that the bearish divergence is playing out.
- Stop Loss: Above the recent high of 0.7445 (or slightly above this level to give some breathing room).
- Target 1: Around the 0.73125 support level (100-day EMA zone).
- Target 2: Further downside potential could target the next support at 0.7250 if momentum accelerates.
- Long Setup – If Support Holds:
- Entry Point: If the price pulls back but holds above the 100-day EMA or the trendline support (0.7375), consider a long position if bullish momentum returns.
- Stop Loss: Just below the support at 0.7370.
- Target 1: 0.7445 (previous highs).
Final Thoughts:
- Short Term Outlook (1-2 weeks): Given the bearish divergence and weakening RSI, I would lean toward a short-term bearish bias. A break of the trendline could trigger a strong selloff.
- Medium to Long Term (1-3 months): The overall trend remains bullish above the 100-day EMA, but if the divergence plays out, we could see a correction toward the lower support levels (0.7250). If these supports hold, the uptrend might resume.
Key Considerations:
- Risk Management: Use tight stop-losses around key levels, especially since divergences can sometimes take time to fully materialize. The trendline will be critical in determining the strength of the divergence.

