Reading time: 3 minutes
Gold futures are trying to stabilize after September’s decline, but the daily trend remains bearish. The August rally failed near $4,720, and the lower highs that followed have brought price back toward the June and July base.
As of today (2 October), price is trading near $4,217.7. It remains below both the 50 and the 200 moving averages, with the 50 at $4,373.4 and the 200 at $4,636.2.
The immediate question is whether buyers can build a recovery above $4,230–$4,250 before sellers force another test of the summer support zone around $4,020–$4,120.
| Level | Why it matters |
|---|---|
| $4,635–$4,720 | Longer moving average and August swing high |
| $4,370–$4,400 | Blue moving average and September trading area |
| $4,300–$4,330 | Recent breakdown area; potential resistance on a bounce |
| $4,230–$4,250 | First resistance above the current consolidation |
| $4,140–$4,160 | Immediate support around the recent selloff low |
| $4,020–$4,120 | Main support zone formed during June and July |
| $4,000 | Psychological level below the summer base |
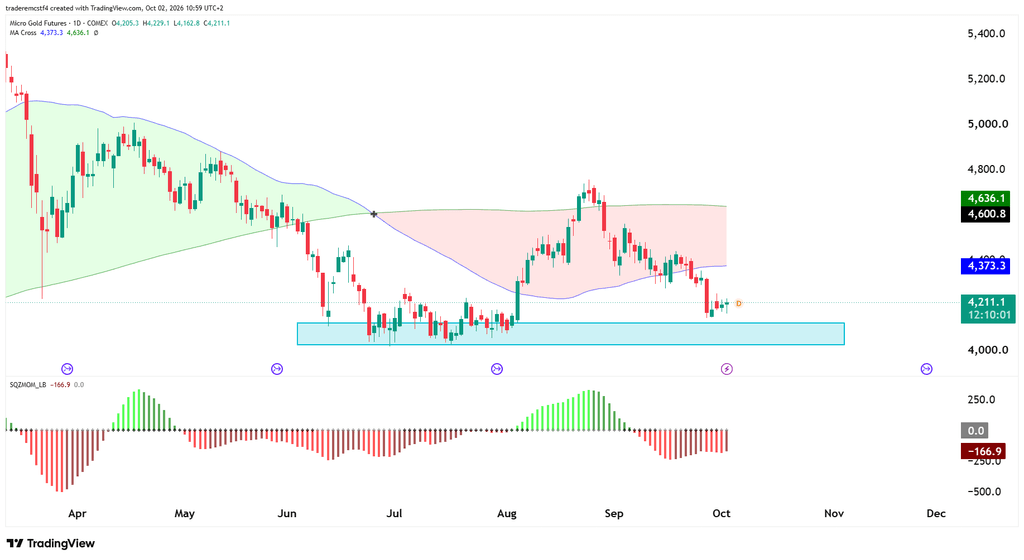
The last few daily candles are much smaller than the selloff candle that preceded them. Buyers have slowed the decline, but the rebound has made limited progress. Today’s recovery from $4,162.8 shows a response to lower prices, although price still needs to clear the nearby highs to establish a stronger recovery.
The highlighted summer base matters because gold spent several weeks trading there before the August rally. That makes it an area to watch for another buying response. The latest decline has not yet reached that zone, so it is too early to say buyers have successfully defended it again.
Momentum also remains negative. The Squeeze Momentum histogram reads approximately −165.7 and sits below zero. This indicator measures momentum; a negative reading does not, by itself, mean the market is oversold. The bars are less negative than at September’s deepest reading, suggesting the decline has lost some momentum, but that improvement has yet to produce a sustained price recovery.
Three developments would help clarify the next move:
- A recovery above $4,250. A daily close above $4,230–$4,250, followed by a pullback that holds, would strengthen the case for a bounce toward $4,300–$4,330. The larger test would then be $4,370–$4,400. Reclaiming that area and forming a higher low would provide stronger evidence that the September decline is changing.
- A break below $4,140. Losing the recent lows would put the upper edge of the summer base near $4,120 in focus. Sellers would then be approaching an established support area, which limits the space available before a possible buying response.
- A failure of the summer base. A daily close below approximately $4,020, followed by an unsuccessful attempt to recover it, would weaken the broader support structure. The next visible reference is $4,000. The chart does not provide enough history below that level to justify a more precise downside target.
For traders, the useful distinction is between a bounce and a change in trend. Gold can recover toward $4,300 or even $4,370 while the broader bearish structure remains intact. Until buyers reclaim resistance and hold a higher low, the small candles near $4,200 show stabilization, with the direction of the next move still unconfirmed.
This analysis is for educational and informational purposes only and does not constitute trading advice or a recommendation to buy or sell any futures contracts. Futures trading involves significant risk and may not be suitable for all investors. Always conduct your own research and consult with a licensed financial professional before making trading decisions.