Introduction
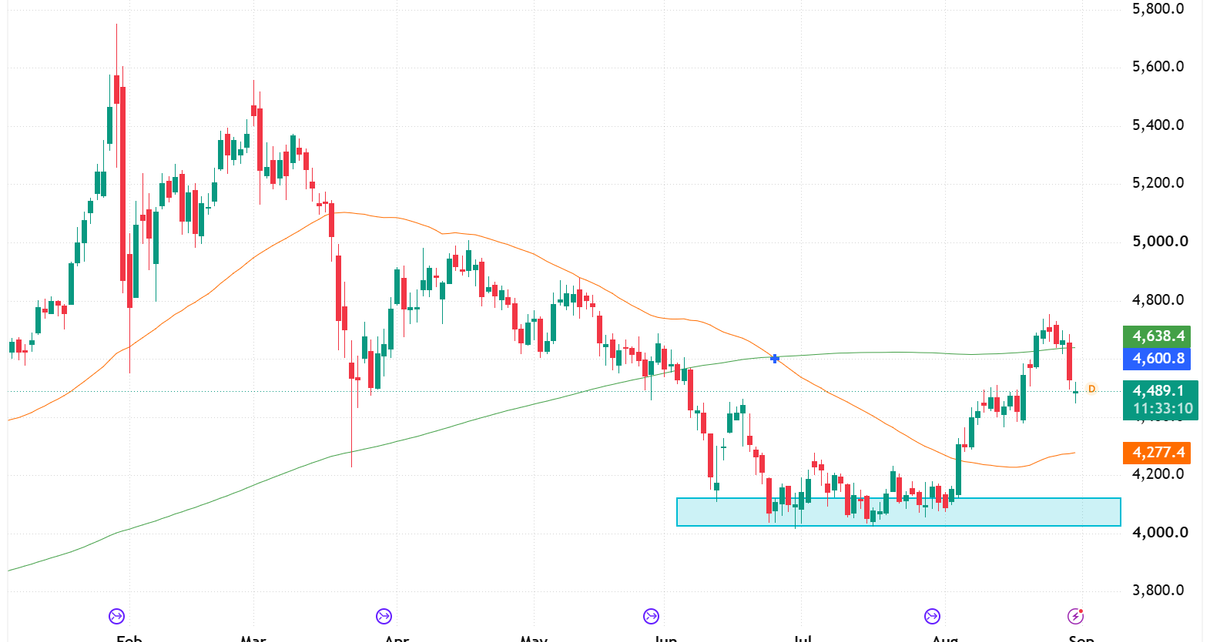
Gold has pulled back from a recent high near 4,650 after testing and breaking above the 200 day MA. What we are watching for now is whether this is just a pullback in a longer-term uptrend or if we move down to the 50-day MA and possibly even below $4,200.
Gold Futures Trend Analysis
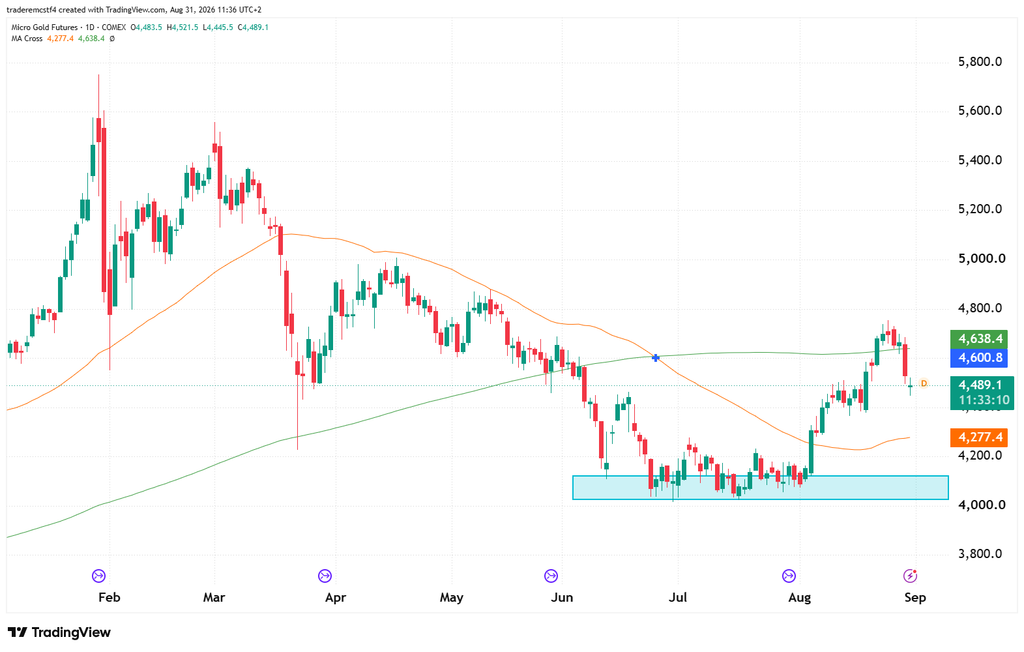
The bigger picture: gold spiked sharply in January and February, corrected hard, then spent the spring grinding lower. In early July, the 50-day MA crossed below the 200-day MA and price continued declining into a support zone around 4,000–4,100 that was tested multiple times through July.
That zone held every time it was tested, and price staged a strong recovery through August, rallying all the way back up to challenge the 200-day MA. Today’s pullback, closing at 4,497.4 after getting as high as 4,521.5, suggests that test didn’t succeed on the first attempt — a normal outcome given how far and fast the August rally ran.
The 50-day MA (4,277.5) has been rising quickly as the August rally feeds into it, and is well below current price, giving the recovery some room before that level becomes relevant again.
Key Levels
| Level | Notes |
|---|---|
| 4,650 | Recent high, the level tested before today’s pullback |
| 4,638 | 200-day MA, today’s rejection level |
| 4,445 | Today’s low |
| 4,277 | Rising 50-day MA |
| 4,000 – 4,100 | Major support zone, tested multiple times in July and held each time |
Possible Trades
Scenario 1: Pullback toward the 50-day MA, then another attempt Given how sharp the August rally was, a pullback toward the rising 50-day MA before another test of the 200-day MA is a reasonable outcome, without threatening the broader recovery.
- Entry: Bullish reaction near 4,277
- Stop: Below 4,100
- Target: 4,638, then 4,650
Scenario 2: Reclaim of the 200-day MA on a second attempt Given the strength of the move off the July lows, a consolidation here followed by a decisive close back above 4,638 would suggest the recovery has more room to run.
- Entry: Daily close above 4,650
- Stop: Below 4,445
- Target: Reopens the case for a retest of levels last seen before the spring correction
Scenario 3: Deeper pullback toward the July support zone Lower-probability near-term outcome given the strength of the August rally, but a break of the 50-day MA would put the 4,000–4,100 zone back in play.
- Trigger: Daily close below 4,277
- Target: 4,000 – 4,100
Summary
Gold’s rally off the July support zone ran into resistance today at the 200-day MA, with a pullback from the recent high to close at 4,497.4. The 50-day MA at 4,277 is the level to watch on any continued pullback — holding it keeps the recovery intact for another attempt at 4,638, while losing it would open the door back toward the 4,000–4,100 zone that’s held all year.
This analysis is provided for educational and informational purposes only and should not be considered financial or trading advice. Trading futures, forex, and other leveraged financial instruments carries a high level of risk and may not be suitable for all investors. Past performance is not indicative of future results. Before making any trading decisions, conduct your own research, assess your risk tolerance, and consult with a qualified financial advisor if necessary.