Most trading strategies were designed for traders risking their own capital, with no rules applied to them. Move one of those strategies onto a funded trader program without adjustment, and it tends to fail. This is because the risk parameters that made it work no longer fit inside the account’s constraints.
The Floor Trader Method is a rare exception. It is a trend-continuation strategy built around two exponential moving averages, and its structure happens to align unusually well with what a prop firm evaluation actually asks a trader to demonstrate: patience, defined risk, and consistency.
This guide covers the method as originally taught, the two modifications that most improve its performance in a funded account, and the part almost every other write-up skips — exactly how much a trader should risk per trade on each account size, and why the answer changes depending on how the firm calculates drawdown.
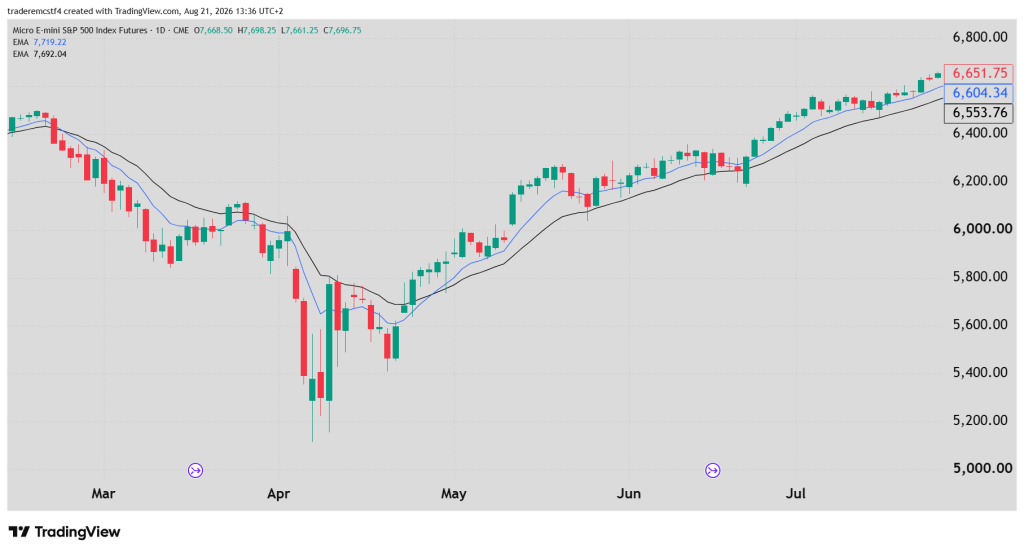
A clean uptrend on a 15-minute chart with the 9 EMA above the 18 EMA, both sloping upward, and price trading clear of both averages. This is the baseline condition, no setup exists without it.
What the Floor Trader Method Is
The method uses two exponential moving averages, a 9-period and an 18-period, plotted on the same chart. Everything else follows from how price behaves around them.
The logic is old and durable. Trends do not move in straight lines; they advance, pause, pull back, and advance again. The two averages create a visual zone that marks where those pullbacks tend to end. Rather than trying to predict a reversal, the method waits for the trend to prove itself, waits for a pullback into that zone, and then waits again for evidence that the pullback has finished before committing.
Three conditions define a valid trend:
The 9 EMA has crossed above the 18 EMA for longs, or below it for shorts.
Both averages slope in the direction of the trend.
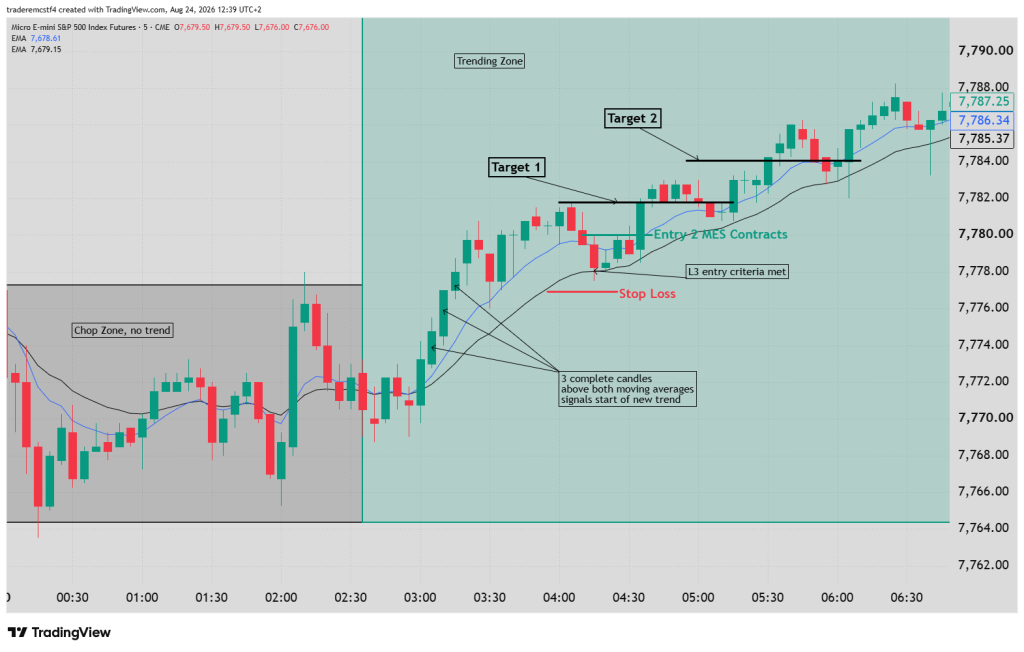
Price has moved clear of both averages, roughly three bars of separation before pulling back.
That third condition is the one traders skip most often, and skipping it is why they end up trading chop. If price never left the averages, there was no impulse leg, and a pullback to the zone is meaningless.
The Three Retracement Levels
Not every pullback into the zone is equal. The original method classifies them by depth, and the distinction matters more than most traders realize.
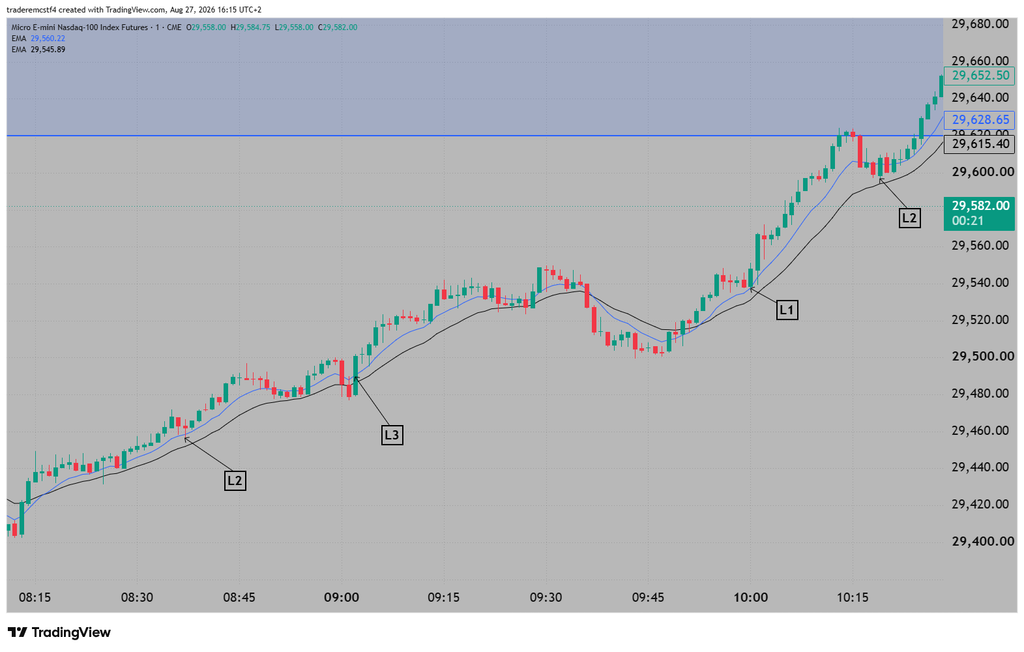
L1 — the shallow retracement. Price barely pulls back, touching or approaching only the 9 EMA. The original guidance restricts L3 to the very beginning of a new trend, when momentum is strongest, and there is the most room ahead.
L2 — the mid-zone retracement. Price enters the area between the two averages but does not reach the 18 EMA. Still valid, slightly worse geometry.
L3 — the deep retracement. Price falls all the way back and touches the 18 EMA. This is the highest-quality setup because the entry sits close to the level that would invalidate the trade, which produces the tightest structural stop and therefore the best reward-to-risk.
Three pullbacks in the same uptrend, labeled L1, L2, and L3, showing how far each penetrates the zone between the 9 and 18 EMA. Annotate the 18 EMA touch on the L1 example.
For traders working through a prop firm evaluation, there is a strong argument for taking L3 and L2 only. Restricting setup selection reduces trade frequency, which may sound like a disadvantage until you consider that most evaluation failures stem from overtrading, not from a lack of opportunity. Fewer, better trades also produce a smoother equity curve and are ultimately more sustainable long-term.
The Trigger Bar
This is the component that separates the Floor Trader Method from simply buying a moving average, and it is non-negotiable.
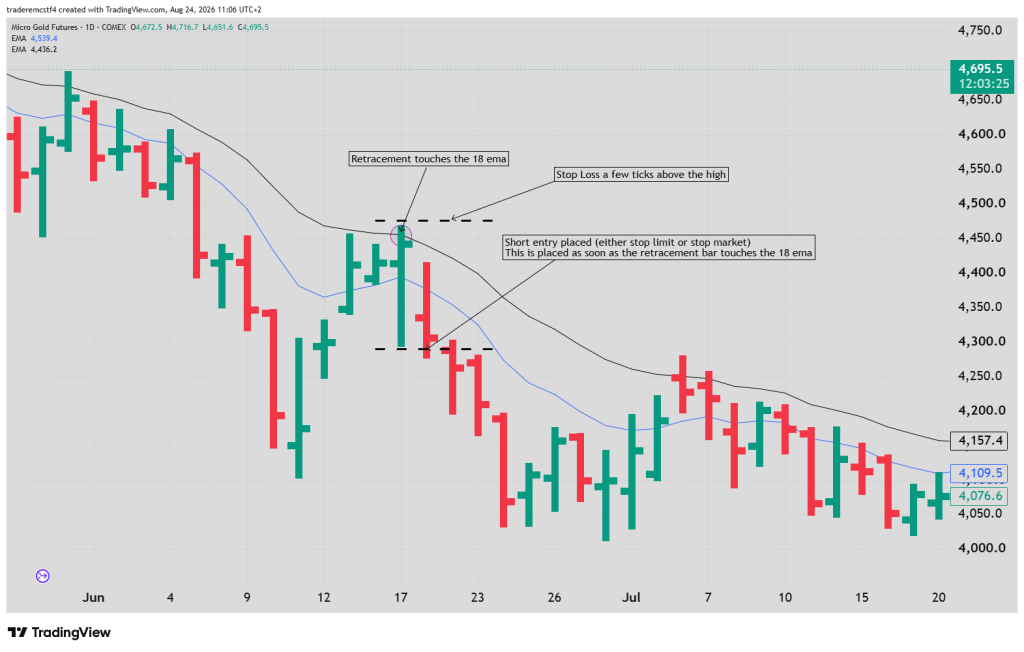
After price has pulled back into the zone, the trader waits for a bar that trades above the previous bar’s high in an uptrend, or below the previous bar’s low in a downtrend. That bar is the trigger. It is the evidence that the pullback has ended and the trend is resuming.
Entry is placed just beyond the trigger bar’s extreme, a buy stop one or two ticks above its high for a long.
Without the trigger bar, there is no filter at all. Price touches the 18 EMA on every pullback in a trend that is about to end, just as it does in a trend that is about to continue. The trigger is the only thing that distinguishes the two, and traders who enter directly at the moving average are automatically catching every failed setup.
Stop Placement: The First Modification
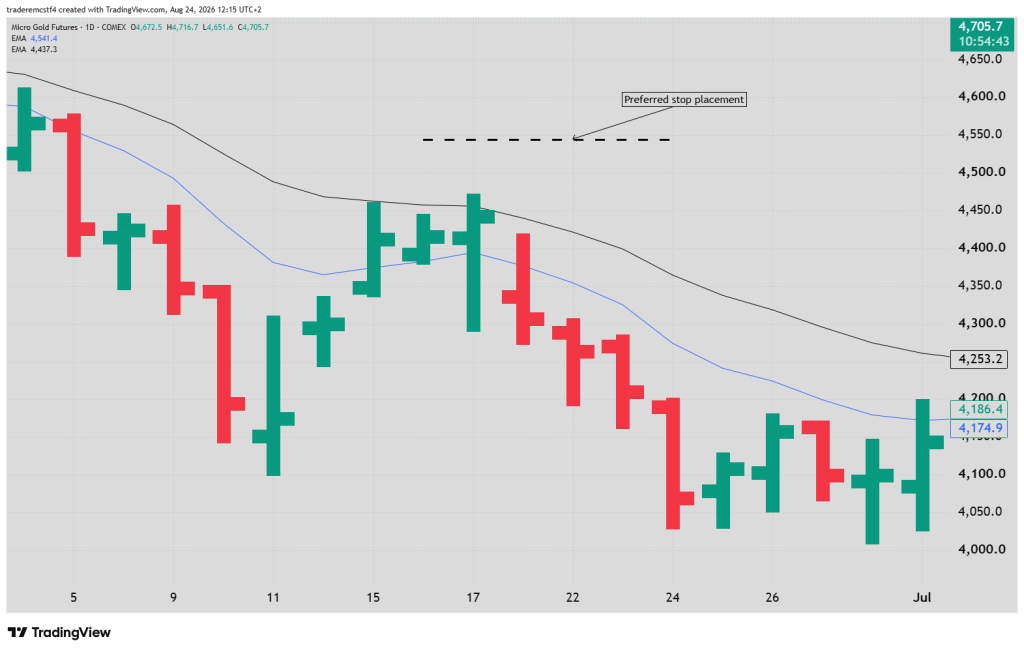
The original method places the stop just beyond the extreme of the retracement. That is structurally correct, and it is the level that signals the trend has failed; however, it is sometimes placed too tightly due to the two-stage correction. Price frequently makes a first push down, bounces, then makes a second slightly lower push before turning for real. A stop sitting immediately beneath the first low has a risk of getting hit just at the time the correction is over.
The fix is to keep the structural logic and add a volatility buffer: place the stop beyond the retracement extreme, then add roughly half of the current ATR of the trading timeframe. It doesnt have to be this exact, you can also eye ball it, the key is to not choke the trade, give it room so that if the stop is hit, you know the signal was a false one.
Why Intraday Trailing Drawdown Changes Everything
OneUp Trader’s evaluation uses an intraday trailing drawdown. It is calculated in real time during the trading session, it rises as the account balance rises, it never moves down, and it includes simulated commissions and fees. Once it reaches the initial starting balance, it locks permanently and stops trailing.
This has three direct consequences for the Floor Trader Method:
Giving back open profit is as expensive as taking a loss. A trader who lets a winner run to +$300 and then trails out at +$50 has spent $250 of drawdown allowance to earn $50. Under intraday rules, it is a significantly high cost.
Wide stops cost more than their face value. A stop is not merely the distance from entry to exit; on an intraday trailing account, the maximum adverse excursion of every trade, including the winners, consumes room while the position is open.
Partial exits become more attractive. Taking half off at a defined multiple of risk converts unrealized profit into realized profit, which locks the gain into the account rather than leaving it exposed to a full give-back.
The practical adjustment is straightforward: on an intraday trailing account, take partials earlier and trail more tightly than the original method suggests.
How Much to Risk Per Trade, by Account Size
This is the question that determines whether a strategy survives an evaluation, and it has almost nothing to do with the strategy itself.
The correct anchor is not the account size, it is the trailing drawdown, because that is the number that actually ends the evaluation. OneUp Trader’s drawdown allowances are:
Account size
Trailing drawdown
Profit target
$25,000
$1,500
$1,500
$50,000
$2,500
$3,000
$100,000
$3,500
$6,000
$150,000
$5,000
$9,000
$250,000
$5,500
$15,000
Working from a risk budget of 3% to 5% of the drawdown allowance per trade, which gives between 20 and 33 consecutive losses of runway, comfortably beyond any realistic losing streak, produces the following:
Account size
Conservative (3%)
Standard (5%)
MNQ points at 5%
MES points at 5%
$25,000
$45
$75
37
15
$50,000
$75
$125
62
25
$100,000
$105
$175
87
35
$150,000
$150
$250
125
50
$250,000
$165
$275
137
55
The Floor Trader Method’s stop distance is determined by structure, not by preference, so it is set to the level where the retracement low sits, plus the ATR buffer. Therefore, position size becomes the output rather than the input. A trader measures the distance from entry to stop, converts it to dollars using the contract’s point value, and divides the risk budget by that figure. Whatever number comes out is the size. There is no need to adjust it upward because the setup looks good.
Targets, Exits, and the Consistency Rule
Targets should come from structure rather than from a fixed point count. The swing high preceding the pullback is the first reference. Beyond that, projecting the length of the prior impulse leg from the entry gives a realistic second target.
Every setup should then be checked against reward-to-risk before it is taken. If the nearest structural target offers less than roughly 2R from the intended entry, the setup is not a trade regardless of how clean it looks.
The exit structure that suits a funded trader program with intraday trailing is a scaled one: take a portion off at 2R, then trail the remainder behind each successive swing low, moving the stop only in the direction of the trade and never backward.
The consistency rule shapes this further. OneUp Trader requires that the sum of a trader’s three next-best days equals or exceeds 80% of their single largest day. The effect is that a single enormous session cannot carry an evaluation — a trader who meets most of the target in a single day must then continue trading to build the supporting days, which usually means exceeding the target substantially before qualifying.
The strategic implication is worth stating plainly: consistent position sizing passes evaluations faster than aggressive sizing, even when aggressive sizing yields a higher raw return. A single outsized day creates an obligation rather than an advantage.
There is also a minimum of 10 trading days, so no evaluation is passed in a single session, regardless of results. That removes any incentive to rush.
Session Timing and Trade Selection
The Floor Trader Method’s documented weakness is sideways markets, where the averages flatten, price crosses back and forth through the zone, and the trigger bar produces a stream of signals that go nowhere. This is why it is very important to remember the three-bar rule. Three FULL CANDLES need to be above the emas for longs and below for shorts. This means the entire bar needs to be above the EMAs, no part of it must be touching.
Since chop follows a fairly predictable daily schedule, session filtering is the single highest-impact adjustment available. Trend initiation clusters around the major session opens; the midday lull between them produces the method’s worst signals. A trader who simply decides not to trade the middle of the session will often improve results more than any change to stop or target logic.
OneUp Trader requires all positions to be closed by 3:15 PM CT, with trading resuming after 5:00 PM CT. This matters for trade selection: a setup taken late in the session may not have time to reach its target before the forced close. Traders should track how frequently their exits are dictated by the clock rather than by the market. A high proportion indicates the chosen timeframe is too slow for the session structure — a fixable problem, and one commonly mistaken for a discipline issue.
Note also that the firm prohibits micro-scalping, high-frequency trading, and strategies built on exploiting market inefficiencies. The Floor Trader Method sits comfortably outside these restrictions; it is, by design, a low-frequency, structure-based approach.
Before Trading It
Any strategy needs validation inside the specific environment it will run in. Two steps are worth completing first.
Count the setups. Review three weeks of historical data on the intended instrument, timeframe, and session window, marking every L1 and L2 that appeared. If the setup produces fewer than two opportunities per week, the plan is not viable at that timeframe, regardless of how well the individual trades perform.
Log the right fields. Recording setup level, session, stop distance in ATR multiples, R-multiple outcome, and exit reason produces a dataset that answers real questions after twenty trades. Recording only profit and loss does not. The difference between a trader who improves and one who does not is usually the presence of that second column.
Adjust the system to suit you. No system is perfect; it is important to adjust the plan to suit your needs, time frames, risk, instruments, and session, all of which need to be factored in. Test it before taking it into a live environment!
Getting Started
Traders who want to apply the Floor Trader Method inside a funded trader program can begin with an evaluation at any of the account sizes above. Based on the drawdown-to-target ratios covered earlier, the $25,000 account offers the most forgiving structure for a trader implementing the methodology for the first time.
Use code UA3QWIT for 15% off any OneUp Trader evaluation. This is a limited offer with only 50 redemptions available. Claim yours before it runs out!
Trading futures involves substantial risk of loss and is not suitable for every investor. Evaluation accounts are simulated environments, and past performance in simulation does not guarantee future results. The strategy described here is presented for educational purposes and does not constitute financial advice. Traders should verify all account parameters, drawdown calculations, and rule details in their own dashboard before trading, as programme terms may change.
Buying and selling the same asset, the same currency pair, the same contracts every day is what turns you into a day trader. You take advantage of intra-day price action aimed to make profits. Futures and spot forex offer the needed volatility almost every day, and with considerable leverage, you can increase the odds of Read More…
What Is Trend Trading? Trend trading is one of the most popular strategies in financial markets, appealing to both novice and seasoned traders alike. At its core, it simply involves identifying and following the direction of market movements, which is why it is important to understand how to read trends correctly and if there is Read More…
Every trade puts you at risk of losing money. How you manage that risk will make a difference between making more profits and blowing up your account. Even successful traders have losing trades because it’s impossible to win every single one. However, they know how to control the risk and ensure their gains on winning Read More…