Follow-Up: What Played Out Since August 12
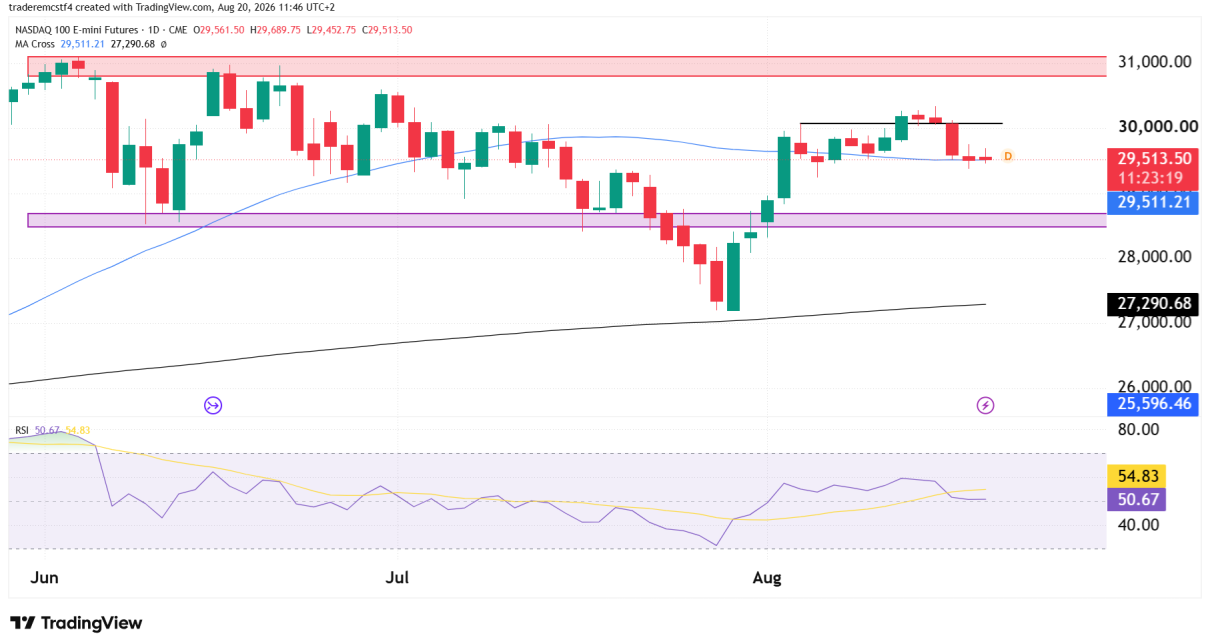
The coil we flagged on August 12 has resolved, and it went the wrong way for the bulls. We had NQ compressed in a 350-point range beneath 30,000, with a close above that number opening 30,300 and a close below 29,553 putting 29,000 back in play. Price spent another week probing the ceiling, never managed a close above it, and has since rolled over. The August 20 session closed at 29,529.50 — 23 points below the breakdown trigger and roughly 265 points lower than where we left it.
So is this the start of a unwind of the August rally, or a market testing the 50 day movingbefore heading higher again?
Trend Analysis
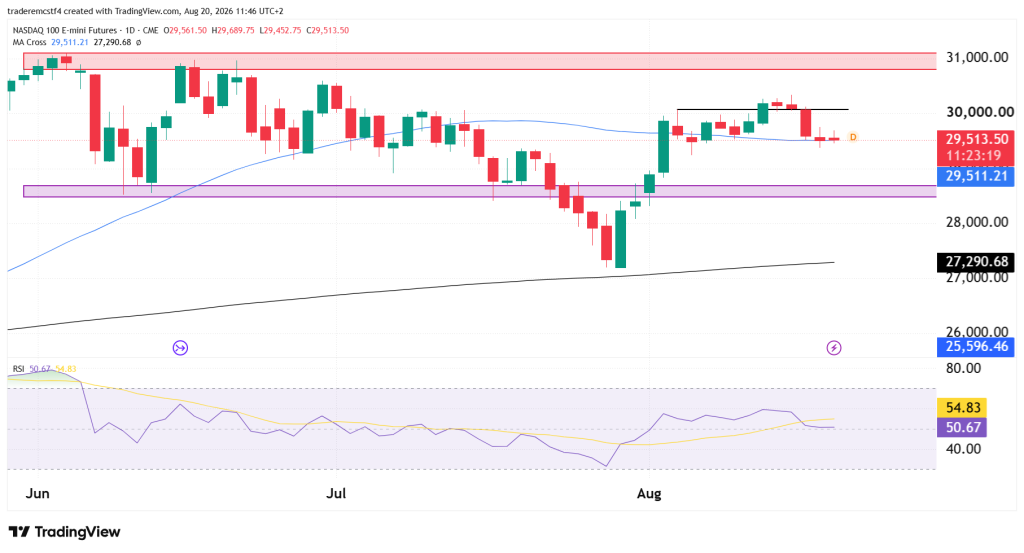
The most important aspect now is the test of the 50 day moving average. If it holds there is a higher chance than not we see NQ rally back up toward the all time high. We also mustnt forget that the S&P 500 has already broken above its ATH so NQ is lagging behind slightly. This small pullback is not unlikely too becuase of the good rally we saw in the beginning of August.
The Rates Problem, in Context
- The July FOMC minutes read hawkish. Released August 19, they highlighted ongoing inflation concerns among officials. The July meeting itself had left rates at 3.50-3.75% with three dissents, as Logan, Hammack and Kashkari each voted for a 25 basis point hike.
- Yet hike odds have fallen, not risen. Subsequent data has pushed expectations for a September hold to around 65%. The pressure on tech is coming from the long end rather than the policy rate, with the 30-year recently at multi-decade highs — and long duration is exactly where Nasdaq is most exposed.
- Treasury intervened directly at that pressure point. The department announced it will at least double its long-dated buyback operations, from $2 billion to $4 billion, targeting the 10-to-20 and 20-to-30 year maturities that have seen a buyers’ strike since late June. Long yields fell on the news, cushioning growth stocks.
Key Support and Resistance Levels
Major Resistance
| Level | Notes |
|---|---|
| 29,689.75 | Session high, the first level to reclaim |
| 30,000 – 30,100 | The ceiling that capped price for two full weeks |
| 30,900 – 31,100 | June high zone, the record area |
Major Support
| Level | Notes |
|---|---|
| 29,511.53 | Faster moving average, directly beneath price and untested on a closing basis |
| 29,000 | Round number, the first real target if the average gives way |
| 28,600 – 28,900 | The shelf that launched the August rally |
Possible Trades
Breakdown continuation
- Entry trigger: daily close below 29,511.53, confirming the moving average has failed
- Stop: above 29,689.75
- Target: 29,000 initial, 28,600–28,900 extended
Reclaim
- Entry trigger: daily close above 29,689.75
- Stop: below 29,511.53
- Target: 30,000 initial, 30,300 extended
Invalidation / range scenario
- A 23-point break of a trigger with the moving average 18 points below is not a decisive move — waiting for a close beneath 29,511.53 costs little and avoids the more likely fake-out
- Nvidia reports on August 26 and is the single largest near-term catalyst for this index specifically; positioning heavily in either direction before it carries obvious event risk
- The Treasury buyback program does not begin until September 9, so the yield relief that supported this session is an announcement effect rather than actual flow
Trading futures involves substantial risk of loss and is not suitable for all investors. Past performance is not indicative of future results. This analysis is for informational and educational purposes only and does not constitute financial advice. Always conduct your own due diligence and consult with a licensed financial advisor before making any trading decisions.