Introduction
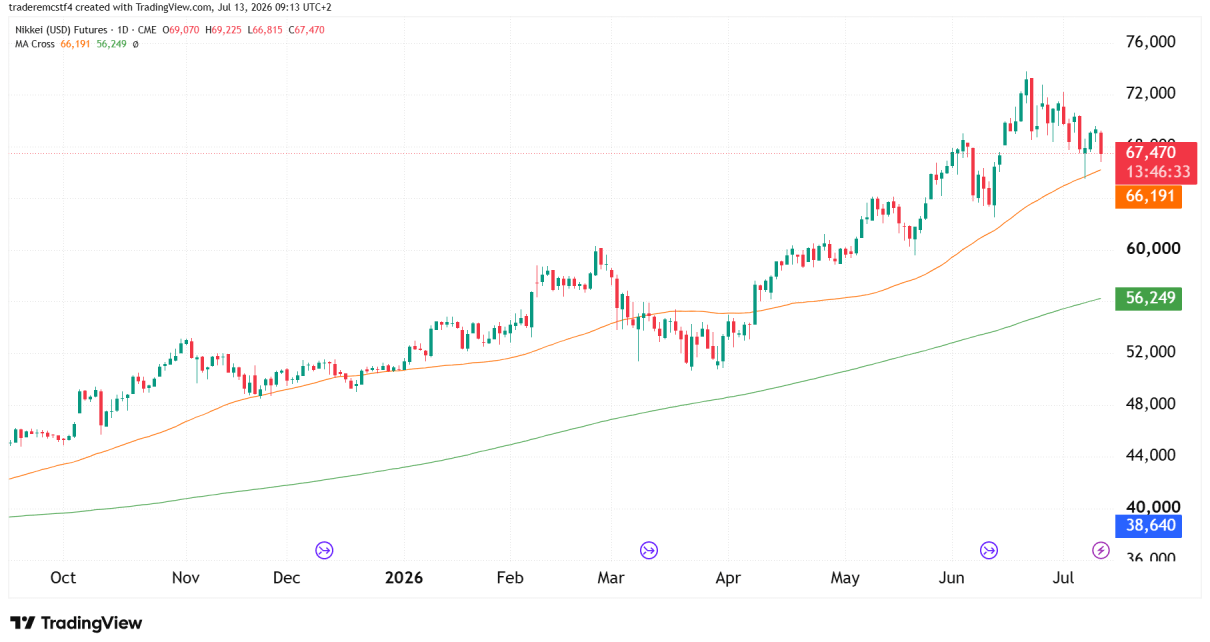
Nikkei futures printed a sharp reversal day today on Monday the 13th of July, opening at 69,070, pushing up to 69,225, then selling off hard to close at 67,355 near the session low. That’s a wide-range bearish candle after a strong multi-month uptrend, and it’s testing the 50-day moving average at the moment.
Looking at the broader trend, it is still firmly bullish so it is very dependent on your time frame for how you position. Lets take a closer look at the technicals and if there are any high probability trade setups we can spot.
Nikkei Futures Trend Analysis
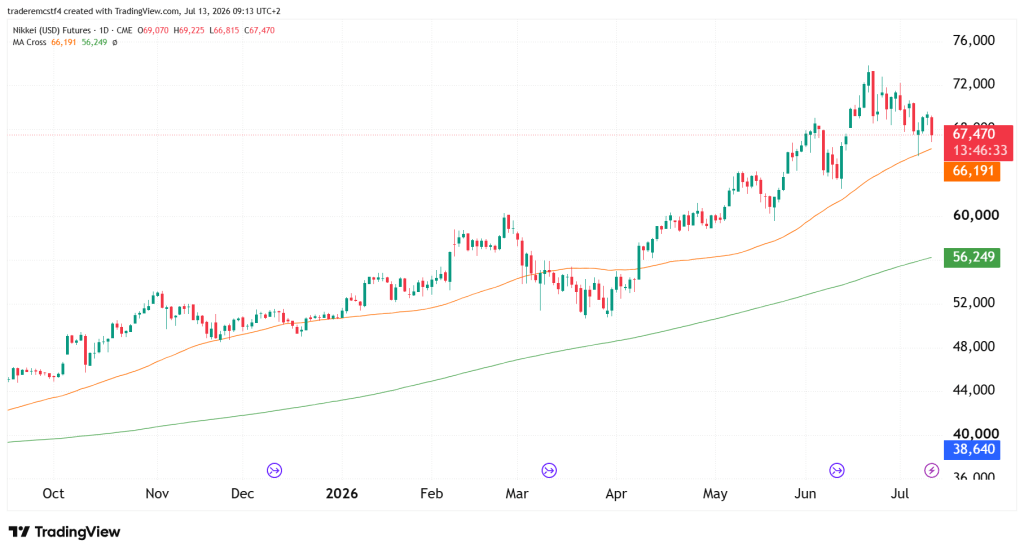
The broader trend has been strongly bullish since last October, with price running from around 44,000 up to a high near 73,000 by June. Since that high, price has pulled back and is now trading at 67,355, still above the rising 50-day MA (66,189) and well above the 200-day MA (56,248) — the longer-term trend remains intact.
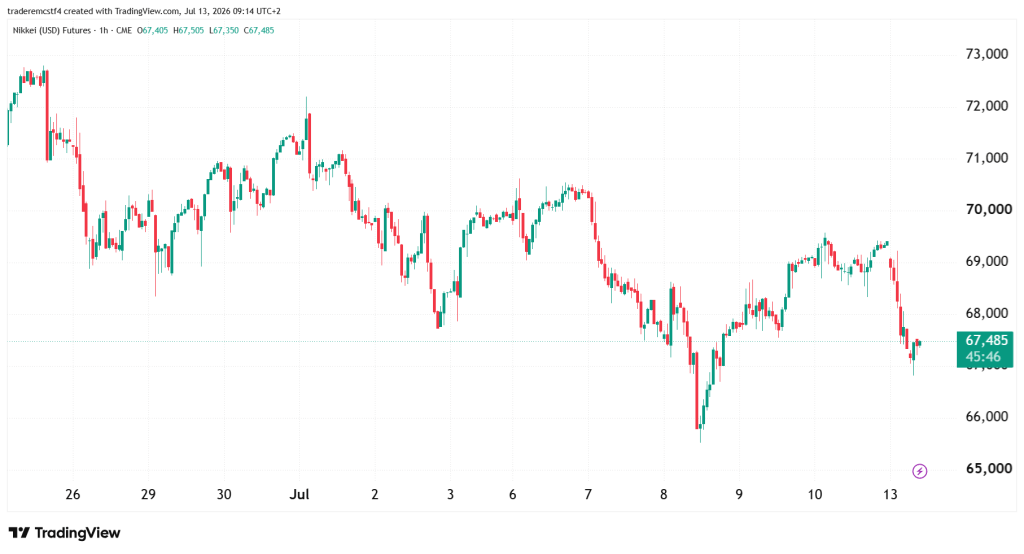
Intraday (1-hour chart): Price has been choppy over the past two weeks, swinging between roughly 65,000 and 72,000. A sharp drop to 66,000 on 8 July was followed by a bounce back to 69,000 by 10 July, but price has since rolled over again and is now consolidating right around 67,350–67,400. That’s the same zone today’s daily close landed in, which lines up the daily and intraday pictures.
Key Levels
| Level | Notes |
|---|---|
| 73,000 | June all-time high, the level any recovery would eventually need to clear |
| 69,225 | Today’s failed high, first resistance on any bounce |
| 66,189 | Rising 50-day MA, immediate support being tested right now |
| 63,000 | Prior breakout zone from May, next support if the 50-day MA fails |
| 56,248 | 200-day MA, confirms the longer-term trend is still intact |
Possible Trades
Scenario 1: 50-day MA holds, uptrend resumes Given the trend is still structurally bullish, a bounce off 66,189 with a reversal candle is a reasonable outcome, especially since price hasn’t broken any major structure yet — just given back some of the June rally.
- Entry: Bullish reaction at or near 66,189
- Stop: Below 63,000
- Target: Retest of 69,225, then 73,000
Scenario 2: 50-day MA fails, deeper pullback The RSI shift below 50 and below its own average adds some weight to this scenario. A daily close below 66,189 would open the door to a deeper correction.
- Trigger: Daily close below 66,189
- Target: 63,000, with 56,248 (200-day MA) as the next major level below that
- Invalidation: A quick reclaim of 66,189 would suggest the break was a shakeout, not a genuine breakdown
Scenario 3: Quick recovery back above today’s high Lowest-probability near-term outcome given the RSI and momentum shift, but a close back above 69,225 would suggest today’s sell-off was an overreaction rather than a trend change.
This analysis is provided for educational and informational purposes only and should not be considered financial or trading advice. Trading futures, forex, and other leveraged financial instruments carries a high level of risk and may not be suitable for all investors. Past performance is not indicative of future results. Before making any trading decisions, conduct your own research, assess your risk tolerance, and consult with a qualified financial advisor if necessary.