

Introduction
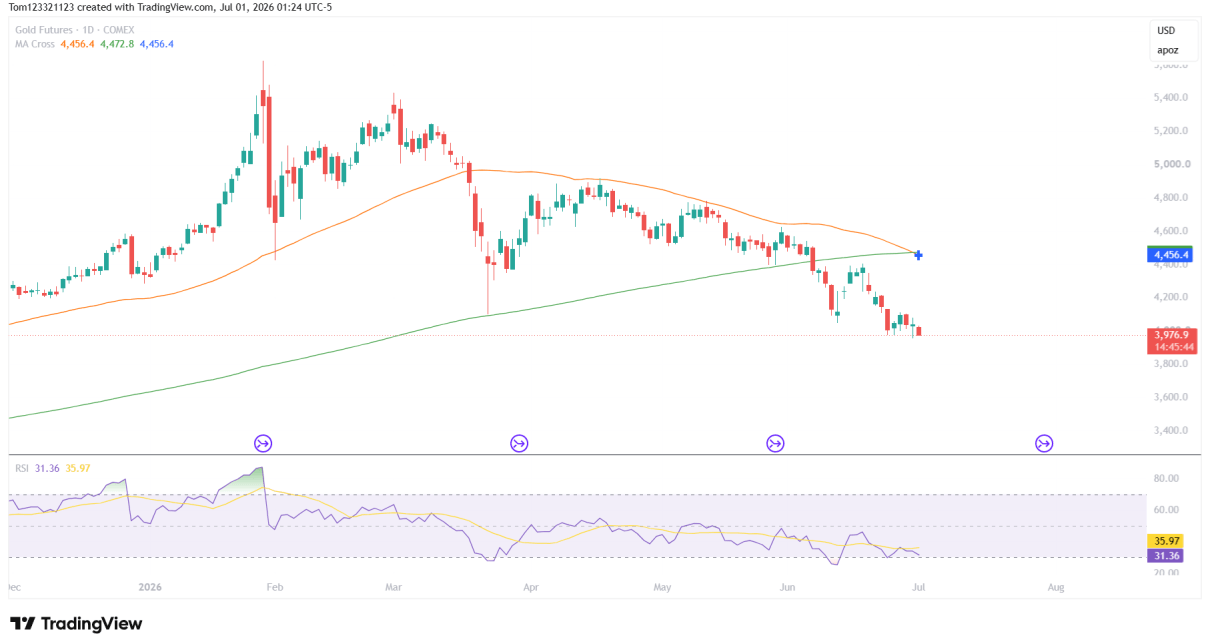
Gold futures have continued moving exactly as we discussed in our previous analysis. After breaking below the major support zone around 4,165, sellers have remained firmly in control, pushing GC below both the 50-day and 200-day moving averages.
When we first looked at the price action in GC, it was more on the side of a pullback in the longer-term uptrend, but now the perspective has shifted. Gold is about 99% there to an established downtrend.
Let’s take a closer look at the chart.
Gold Futures Trend Analysis
Gold is also trading below both the 50 and the 200 moving averages, and there has been a death cross with those two moving averages, too. The RSI is approaching oversold so all the indicators are pointing bearish. From here, it is difficult to find a case for the bulls, but there is some support at the current price, and if the bulls are to have a hope of recovery, they need to hold this level.
A drop below $3,900 starts bringing $3,450 into sight for the sellers.
Estimated Probabilities for Gold Futures
| Scenario | Estimated Probability | Market Interpretation |
|---|---|---|
| Consolidation around 4,000 before the next move | 45% | Selling pressure begins to slow as buyers defend psychological support |
| Continued decline toward 3,800 support | 40% | Bears maintain control and extend the downtrend |
| Recovery back above 4,160 resistance | 15% | Buyers regain short-term momentum and trigger a larger relief rally |
Key Support and Resistance Levels
Major Resistance Levels
- 4,160 previous support
- 4,450–4,475 (50-day and 200-day moving averages)
- 4,600
Major Support Levels
- 4,000 psychological support
- 3,800–3,850 demand zone
- 3,600 longer-term support
Gold Futures Possible Trades
Bearish Continuation Trade
The primary trend remains bearish. As long as Gold continues trading below the major moving averages, rallies may continue attracting selling pressure. A decisive break below 3,900 would likely increase the probability of another move toward the 3,450 area.
Support Reaction Trade
The 4,000 psychological level is now the most important area on the chart. If buyers begin defending this region aggressively, Gold could enter a period of consolidation or produce a short-term relief rally after the recent decline.
Bullish Recovery Trade
For the bullish outlook to improve meaningfully, buyers would first need to reclaim 4,160 and then recover above both the 50-day and 200-day moving averages. Until those levels are recovered, any rallies are likely to be viewed as corrective moves within the broader downtrend.
This analysis is provided for educational and informational purposes only and should not be considered financial or trading advice. Trading futures, forex, and other leveraged financial instruments carries a high level of risk and may not be suitable for all investors. Past performance is not indicative of future results. Before making any trading decisions, conduct your own research, assess your risk tolerance, and consult with a qualified financial advisor if necessary.
