

Introduction
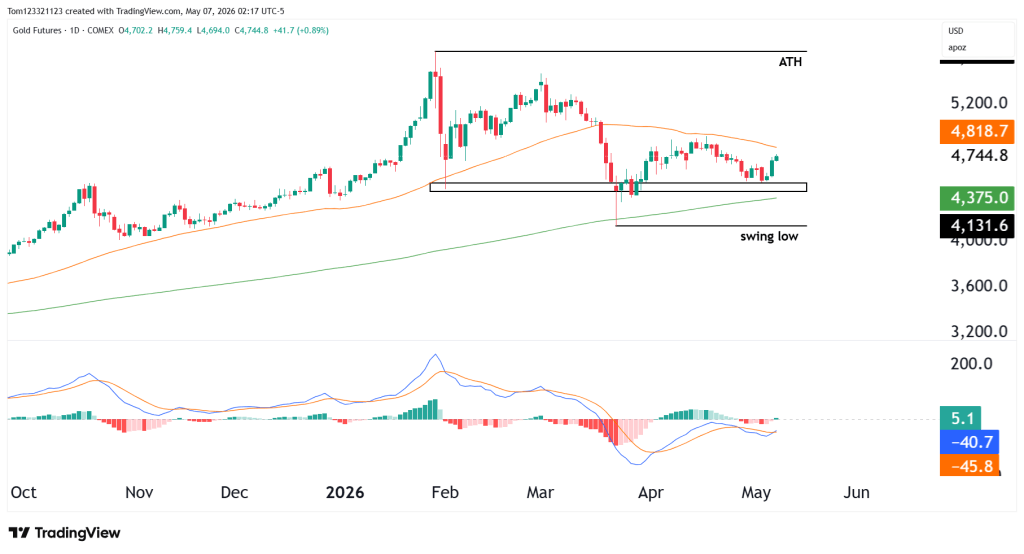
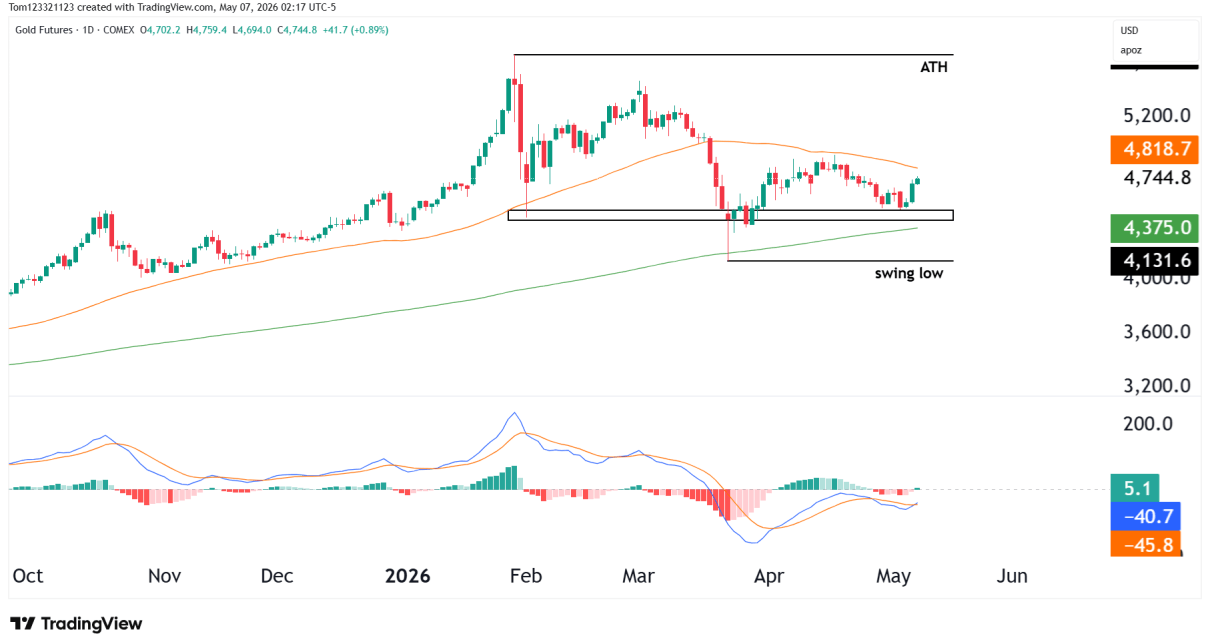
Gold is starting to bounce again out of the support zone at $4,400. Profit-taking has been the narrative of the story since the end of January, after the huge rally we saw in the yellow metal. Now that we see price stabilizing, we can look at good ways to approach the market moving forward, and if the rally is likely to continue.
Price continues to struggle once it approaches the 4,750–4,850 area, and the rallies do not yet have the same strength that defined the earlier uptrend. That is important because strong recoveries usually reclaim resistance quickly. Gold has not done that yet.
Important Levels
The structure is becoming cleaner now that support has been tested multiple times.
- Support: 4,350–4,450
- Major swing low: ~4,130
- Resistance: 4,800–4,850 (50-day moving average zone)
- ATH: Above 5,500
As long as price continues holding above the support zone, the market has room to consolidate and gradually recover.
If support breaks, though, the next move likely becomes much deeper, with the swing low near 4,130 becoming the next major area to watch.
The MACD is still below the zero line, which tells you the longer trend has not fully turned yet, but the histogram has started to stabilize and the downside pressure is no longer expanding the way it was earlier.
Scenarios and Probabilities
| Scenario | Description | Estimated Probability |
|---|---|---|
| Consolidation | Holds above support and trades sideways | 45% |
| Recovery | Reclaims 4,850 → move toward 5,000+ | 30% |
| Breakdown | Loses support → move toward 4,130 | 25% |
At the moment, consolidation remains the most likely outcome. Gold appears to be trying to build a floor, but it still needs stronger momentum before a larger recovery can begin.
Possible Trades
Longs start to make more sense near support rather than after extended rallies. As long as price keeps defending the 4,350–4,450 zone, buyers at least have a defined level to work against.
More aggressive longs likely need a reclaim of the 4,800 area, which would signal that momentum is finally starting to shift back upward.
Shorts become more attractive only if support breaks cleanly, especially if price starts accelerating lower instead of drifting.
Put Your Skills To The Test & Start Your Evaluation Today!
This analysis is for educational and informational purposes only and does not constitute trading advice. Futures and forex trading involve significant risk and may not be suitable for all investors. Always conduct your own research before making trading decisions.
