


Introduction
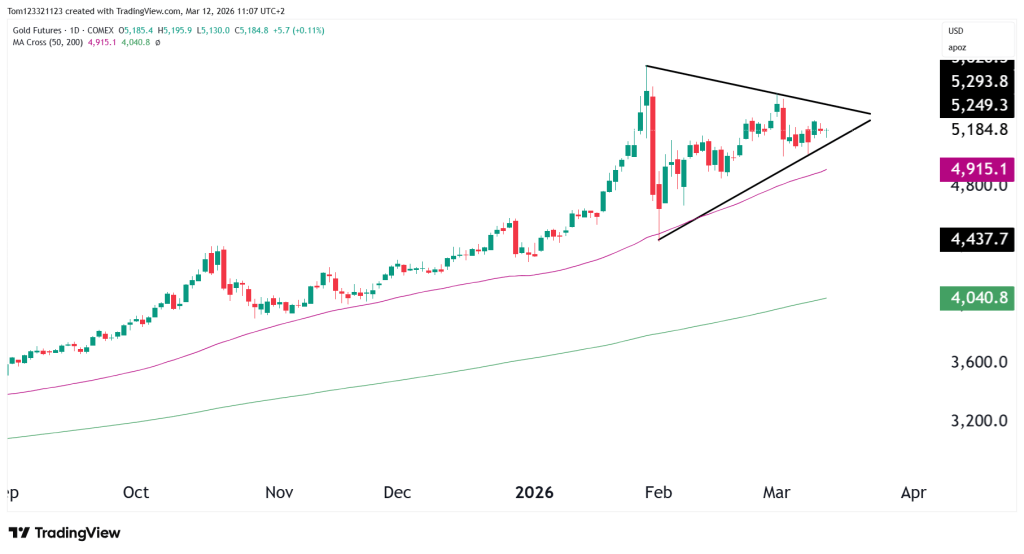
Gold futures (GC) continue to consolidate after the strong rally that pushed prices above $5,300 earlier this year. In the previous analysis from March 4, we highlighted the formation of a symmetrical triangle pattern developing after the sharp February correction.
Since then, price has remained inside that structure, with not much change in volatility since the escalation in the middle east. We expected there to be more price movement in the metals because of a rush to safe havens, but most of the volatility seems to be focused on crude oil.
With the steady and more predictable price action in gold, let’s take a closer look at the technicals and if there are any possible trades.
Market Structure & Trend
Daily Chart
The clear and main feature is the symmetrical triangle formation. Bulls are pushing the prices higher within the structure with the higher highs and higher lows on the chart. Gold has been firmly bullish last year and that strength has moved into this year with no real sign of it slowing. It also looks like the volatility in the Middle East has been priced in, which could be why we did not see much movement in the price since the start of the war.
Back on the technicals, the 50-day moving average is the most important price level that will need to be maintained.
Key Technical Levels for Gold
Resistance
$5,250 – $5,300
This would lead to a possible new ATH in gold.
$5,600
If the triangle breaks to the upside, this becomes the next likely upside target.
Support
$5,100
Short-term consolidation support inside the triangle.
$4,915
The 50-day moving average, which is currently the most important support level.
$4,440
The February capitulation low and the lower boundary of the triangle structure.
A break below this level would invalidate the bullish consolidation pattern.
| Scenario | Description | Estimated Probability |
|---|---|---|
| Bullish Breakout | Break above $5,250–$5,300 triggers momentum buying, pushing gold toward $5,500–$5,600. | 45% |
| Continued Consolidation | Price remains inside the triangle, trading between $5,100 and $5,250. | 35% |
| Bearish Breakdown | Price breaks below the ascending support trendline, leading to a retracement toward the 50-day moving average near $4,915. | 20% |
Final Takeaway
Gold futures are stuck in a symmetrical triangle, which has more bullish power than bearish. There are higher highs and higher lows within the triangle, and any small pullbacks could be buying opportunities for bulls.
The key thing to watch now is a breakout from the triangle pattern.
- If the price moves above $5,300, it could signal a continuation of the upward trend.
- If it falls below the rising support line, gold could drop toward $4,900.
The more predictable price action in the yellow metal makes it an attractive market to be trading especially during these volatile times.
This analysis is for educational and informational purposes only and does not constitute trading advice. Futures trading involves significant risk and may not be suitable for all investors. Always conduct your own research before making trading decisions.
