


Introduction
In today’s crude oil analysis, we will do a quick recap of the price action that we saw from the spike in Monday’s session after the escalation over the weekend.
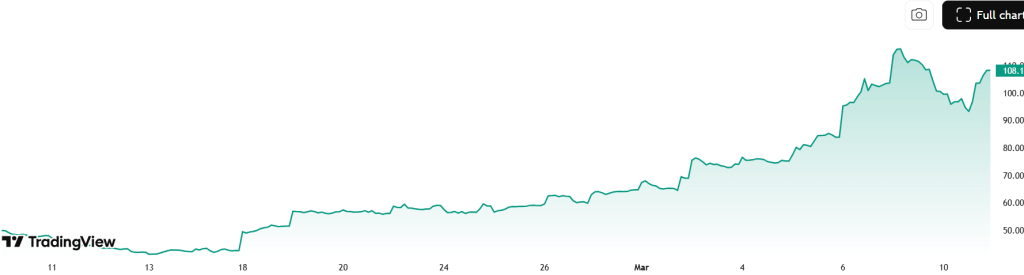
In Monday’s analysis, we saw a 30% spike after the weekend’s trading activity. CL has been very volatile as it continues in price discovery mode. Lets take a closer look at the technicals and what they are telling us.
What Happened After the Weekend Spike?
On Monday, the analysis was all based around the fact that recent price action in CL was caused by escalations in the Middle East and the attacks on the crude oil inventories in the region.
Crude jumped sharply from the mid-$60s to above $100, and briefly came close to $120 during the day before quickly pulling back. Today, prices are still under pressure as traders lock in profits after the spike.
That kind of move is normal. After a big geopolitical shock, markets often see:
- traders taking profits after getting in early
- forced selling caused by high volatility
- algorithms pushing prices back toward the average
- liquidity adjusting after the sudden move
Even after the pullback, crude is still well above where the rally started. That suggests the bigger breakout is still in place for now.
Oil Volatility Index (OVX) – What It Tells Us
Crude oil has its own volatility index called the CBOE Crude Oil Volatility Index (OVX).
OVX shows what the market expects crude oil volatility to look like over the next 30 days, like the VIX does for the S&P 500.
In normal conditions, OVX usually stays between 25 and 35. But during geopolitical tension or supply shocks, it can jump higher. For futures traders, a rising OVX means wider price ranges and faster moves, which can create more opportunities but also more risk.
If the indicator starts to lower, it means price discovery is starting to normalize, the higher the indicator goes the more volatile the price action will be.
Key Technical Levels for Crude Oil
Resistance
$100 – $105
This area is the first major resistance zone after the spike rejection. If geopolitical tensions escalate again, crude could quickly retest this region.
$115 – $120
This was the extreme spike zone. If price returns here quickly, traders should watch for potential blow-off behavior or liquidity sweeps.
Support
$85 – $90
This is the current trading zone and the first important support zone following the spike.
$75 – $80
This is the next major support zone and a likely target if crude continues to retrace the spike.
$64 – $66
This area contains both the 50-day and 200-day moving averages, which previously acted as the breakout level.
Scenarios Going Forward
If tensions escalate further, crude could stabilize near $90–$100 before attempting another rally toward $110+.
Consolidation Phase
Crude could begin forming a range between:
$80 – $100
Final Takeaway
Crude oil looks like it’s moving out of the first shock phase of the geopolitical rally and into a period of choppy, high-volatility trading.
The jump toward $120 was likely caused by fears of supply disruptions after attacks affected oil infrastructure and inventories. Since then, prices have started to pull back as traders take profits and rethink the situation.
For traders, the key levels to watch are $90 on the downside and $100 on the upside. It is important to watch the news and developments in the middle east.
This analysis is for educational and informational purposes only and does not constitute trading advice. Futures trading involves substantial risk and may not be suitable for all investors. Always conduct your own research before making trading decisions.