


Introduction
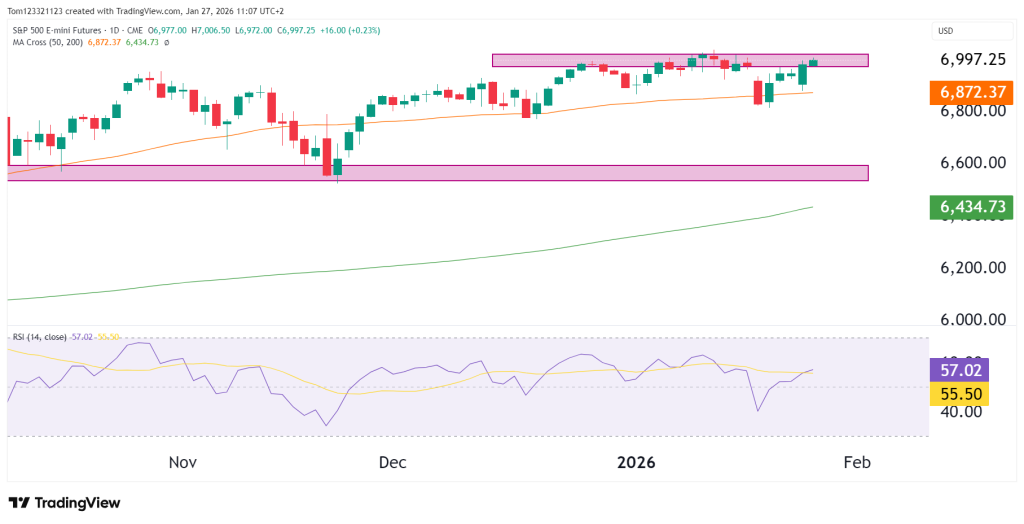
The S&P 500 E-mini Futures (ES) are once again near the top of their recent range, trading just below the 7,000 level after holding earlier support. Price bounced cleanly from the latest pullback and is now testing resistance again, which shows that buyers are still in control even after multiple attempts to push lower.
This is a familiar but important setup. When markets repeatedly return to highs without strong follow-through to the downside, they often move higher and hold those levels rather than reverse lower.
Lets take a look at the technicals and what they are telling us.
Summary
Primary trend: Bullish
Current conditions: High-level consolidation with upward pressure
Line in the sand: 6,850–6,870
Bias-defining level: 7,000 acceptance
Risk to thesis: Loss of 6,800 on a closing basis
Market Structure & Trend
Daily chart

On the daily chart, ES continues to make higher lows, with buyers regularly stepping in around the 6,850–6,880 area. Each time price dips into this zone, buying pressure shows up quickly, which tells us demand is still strong. The 50-day moving average is still pointing higher and once again provided support during the latest pullback, reinforcing the idea that the broader trend remains intact.
Price is now moving sideways just below the 6,950–7,000 resistance area, which has stopped rallies several times in the past. What stands out is that each pullback from this level has been smaller than the last. Sellers are unable to push price meaningfully lower, suggesting that selling pressure is being absorbed rather than leading to a sustained move down.
As long as the 6,850–6,880 support zone continues to hold, this price behavior favors continuation to the upside rather than a reversal.
Key Technical Levels
Line in the Sand
- 6,850–6,800: A sustained break below this zone would shift the short-term bias from consolidation to correction.
Bias-Defining Levels
- 7,000: Acceptance above this level would likely trigger momentum expansion and trend continuation.
- 6,850–6,880: Ongoing defense confirms buyer control.
Extension / Reference Levels
- 7,050–7,100: Upside extension if price breaks and holds above ATHs.
- 6,600–6,650: Deeper weekly support in the event of a broader pullback.
Looking Forward: Scenarios
Bullish Continuation (45%)
Acceptance above 7,000 opens the door for a move toward 7,050–7,100 as sellers are forced to cover.
Sideways Consolidation (35%)
Price continues to rotate between 6,850 and 7,000, weakening resistance through repetition.
Deeper Pullback (20%)
A failure to hold 6,850 triggers a move toward the 6,600–6,650 weekly support zone.
Bottom Line
ES is holding just below all-time highs, with buyers continuing to defend higher lows and momentum leveling out. This looks like an accumulation rather than a sale. As long as key support holds, repeated tests of resistance increase the chances of a breakout higher instead of a sustained pullback.
This analysis is for educational and informational purposes only and does not constitute trading advice or a recommendation to buy or sell any futures contracts. Futures trading involves significant risk and may not be suitable for all investors. Always conduct your own research and consult with a licensed financial professional before making trading decisions.

